
Tim Toohey, Head of Macro and Strategy, unpicks the Reserve Bank of Australia’s recent approach to monetary policymaking and concludes the risks of an economic hard landing are on the rise.
The relentless monetary tightening cycle in Australia has continued, even as evidence that economic growth is groaning under the strain of prior hikes. However, more concerning is that the Reserve Bank of Australia (RBA) has shifted the goal posts, providing a rationale for even higher interest rates and unsettling financial markets in the process.
It is worth diving into the rationale behind the RBA’s recent decisions, as the economy is demonstrating classic signs of a tipping point and policy error at this stage of the cycle can have dramatic portfolio impacts.
Are we in a price-wage spiral or not? It depends on what month it is
To recap, the RBA set the doves scampering in February when they went out of their way to highlight that wages were accelerating and flagging “the importance of avoiding a prices-wages spiral”. It was interesting that they switched the order to a price-wage spiral – implying the causality would run from wage earners trying to keep up with cost-of-living pressures, rather than the more familiar example of the 1970s of wages feeding into cost push inflation and back into wages. Nevertheless, it was a cathartic shock for rates markets.
However, in March suddenly the RBA appeared to have a change of heart. They acknowledged that wages growth was continuing to pick up in response to the tight labour market but “wages growth is still consistent with the inflation target and recent data suggest a lower risk of a cycle in which prices and wages chase one another.” So in a month the RBA appeared to have gone from being on alarm to being relaxed.
Of course, four weeks seems to be a long time for this version of the RBA to hold a story straight, so you won’t be surprised to learn that in April the RBA Board was not only back on “alert to the risk of a prices-wages spiral” but added a new nuance by stating that “wages growth is still consistent with the inflation target, provided that productivity growth picks up.”
Recently we had the Governor in front of the Senate Committee stating that current wage growth is not a problem, and instead that it’s all about productivity which is beyond the RBA’s control. There was a reference to award wages being higher than last year’s Fair Pay Commission ruling but this doesn’t seem to be sufficient to materially change the RBA’s view on wages.
So, after describing the May decision to increase interest rates as “finely balanced”, the RBA followed up with a further hike in June and has flagged that further tightening may be required.
Are you confused yet? Maybe you are not working hard enough…
It’s pretty reasonable to ask at this point: what’s going on?
The preamble is that you might remember that the RBA moved to a backward-looking approach to monetary policy in the aftermath of COVID, partly because they deliberately wanted to be late to tackling inflation. The RBA Governor said that the bank wanted to “see the white of inflation’s eyes” before taking any action. It was a classic case of being careful what you wish for, as inflation quickly and painfully came into view.
The idea was that they wanted inflation expectations to become more entrenched after years of undershooting their target. This backward-looking framework was mostly due to the observation that the Phillips Curve seemed to be ‘flat’ – lacking any real trade-off between inflation and the unemployment rate – and given the Phillips Curve was the workhorse behind all the RBA inflation models of the past 25 years, the RBA had lost confidence in their ability to forecast inflation. So the RBA foolishly decided the best way to run policy was merely to look at where inflation had been rather than making an informed decision on where it was going to be.
For much of the past year the RBA looked at the historical data and decided inflation was a supply side issue. Indeed, the RBA spent many months asserting that between two-thirds to three-quarters of the rise in inflation could be attributed mostly to temporary supply issues due to the aftereffects of COVID stimulus and the Ukraine invasion.
However, sometime in the past two months the RBA has had a stark change of mind. The RBA is suddenly convinced that it is excess unit labour costs and poor productivity growth that is the problem, and this risks persistent inflation. In a Linda Blair worthy head-turning twist of logic, the RBA spewed forth the suggestion that the real problem driving inflation is that we are just not working hard enough. The Governor even suggested that a second job might be a good idea for people struggling under cost-of-living pressures.
The RBA jumps ship from supply-side shortages on to excess labour costs
What prompted this change? The RBA’s main inflation model is heavily weighted to the movement in unit labour costs and, to a lesser degree, the change in the unemployment rate. So higher unit labour costs are obviously bad for future inflation. At first glance unit labour costs might look excessive, having risen in nominal terms by close to 10%yoy – the fastest increase since 1990.
For the sake of clarity, productivity is normally defined as economic output divided by the number of hours worked (or by the number of employees) and average labour costs (ALC) is just total compensation of all employees divided by the total number of hours worked. Unit labour costs (ULC) are Average Labour Costs/Productivity. So, when thinking about ULCs there are four main things to consider: (i) wages per hour; (ii) total number employed; (iii) hours worked; and (iv) total output.
Typically, the main reason why ULCs increase is because wage rates are rising. But that is not the only way ULC’s can rise. Indeed, it is worth breaking down the inputs into ULCs, because the answer might surprise.
Are labour costs really currently a threat to inflation?
The broadest measure of labour costs is total compensation of employees from the National Accounts, and it is currently unquestionably strong, expanding at 10%yoy. The decomposition is shown in Chart 1.
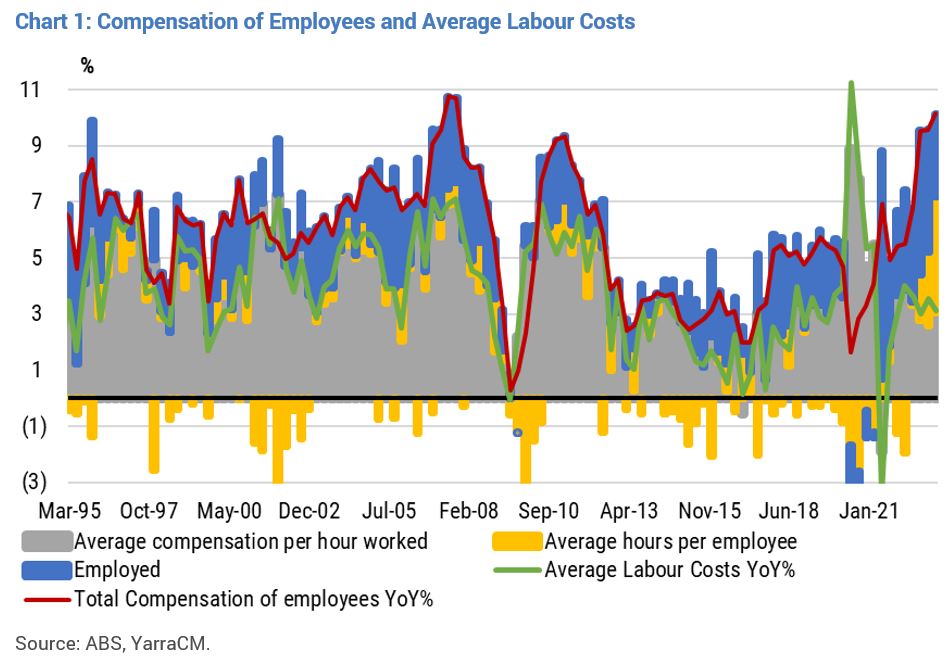
There are several things that stand out.
Firstly, employment growth has been strong and has been a consistent source of growth in the total wage bill. Nevertheless, it is starting to slow. Moreover, declining job advertisements and rising job applicants per job ad suggest that labour demand is easing relatively quickly at the moment whilst labour supply is rising sharply. That is, the unemployment rate is likely to commence a sustained rise in coming months and employment growth will likely continue its slowdown.
Secondly, hours worked rose an impressive 7.2%yoy and hours worked per employee rose 3.3%yoy – this has been the main reason behind the recent acceleration in total compensation of employees. Excluding the COVID-restart, this growth in hours worked per employee is the largest since the data commenced in 1980. In contrast to the Governor’s assessment that Australian’s aren’t working hard enough, they are currently working harder than ever! One should also keep in mind that there was a surge of 123k additional international students in the March quarter, of whom a third work part time on average – helping to explain ~3.5% of the jump in total hours worked.
Importantly, the growth in average compensation of employees per hour worked is 3.4%yoy – this is below the 20-year average of 3.9% between 2000 to the pre-COVID period. This runs completely against the narrative that wage growth is problematic. If we look beyond the National Accounts wages as measured by the Wage Price Index, it is running at a solid but not alarming 3.7%yoy, yet other high frequency data suggests that wage growth may even be slowing. This is despite the attention given to the Fair Pay Commission decision, which we calculate to have only a relatively minor impact. While a 5.75% rise sounds large, it adds just 0.3% to wages growth next year. In short, wages growth is not the problem.
Putting this all together, the reason unit labour costs (ULCs) are high is not because people are getting paid excessively for each unit of work done. It is because people are working a lot more hours, in part due to there being more people in the country and in part due to increased effort.
What about productivity? When economic growth slows, by definition, productivity declines cyclically. i.e. you are selling fewer less widgets but with the same inputs of capital and labour. Economic output growth barely grew in March and has slowed sharply to just 2.3%yoy. On a per capita basis the economy has shrunk over the past six months and the data we have at hand for the June quarter suggests that worse growth outcomes lie ahead in the remainder of the year. This slowdown has come about directly in response to the RBA’s tightening cycle and the Government’s attempt to get out of the RBA’s way and curtail its spending. If we are raising rates because of a short-term cyclical fall in productivity, then we are caught in a policy induced doom loop.
We would argue it’s more sensible to look at longer term productivity growth. The 10-year average of labour productivity is just below 1%. After years of the RBA chanting the mantra that wages growth of around 3.5% is consistent with the inflation target if productivity is around 1%, then everyone should agree that current wage rates are not a structural threat to inflation. However, the RBA seems to be putting large weight in the recent decline in productivity. The RBA – and nobody else for that matter – can truly know with any degree of accuracy what impact COVID has had on productivity (whether that is WFH, long-COVID, reduced on the job training etc..), or what impact the recent develops of AI might present for productivity.
Indeed, there is also the open question of whether we are even measuring productivity accurately at all; the more we become a serviced based economy, the less accurate the productivity data is likely to be. Given most of the economic growth in recent months has come via the services sector, it is likely that recent poor productivity is more about mismeasurement than lack of worker efficiency. It is a dangerous idea to attempt to fine tune monetary policy when using a poorly measured and poorly understood concept as productivity, particularly when looking at its short-term movements.
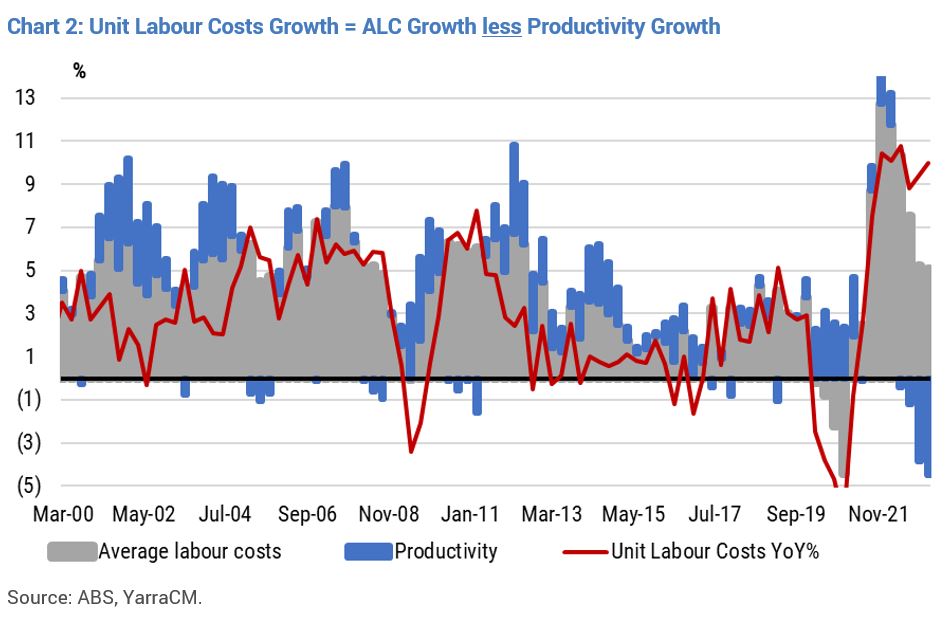
If it is merely the case that the productivity data is being measured incorrectly – or at the very least distorted by the service sector recovery – then as Chart 2 shows, unit labour costs would currently be easing at present. That is, unit labour costs are really just the difference between easy-to-measure average labour costs and notoriously-difficult-to-measure productivity.
Let’s at least look at the total picture and question what’s behind weak productivity
Even if one is prone to looking at productivity as a reason to adjust policy, then at least the policy maker should look at more than just labour productivity. Capital productivity (output per unit of capital) and multifactor productivity (which is output obtained from the joint use of the factors of production) actually surged in 2022, by 3% and 2.2% respectively, according to the annual National Accounts.
All of this is to say that the RBA needs to look very carefully at the real reason why unit labour costs are strong. It does not reflect a surge in inflation generating labour costs. It reflects:
- A surge in immigration being quickly absorbed in the workforce, which has generated a surge in total hours worked;
- A surge in average hours worked per employee which reflects increased effort and likely an attempt to stay ahead of cost-of-living pressures; and
- A decline in productivity, which may well reflect the time invested in training the surge in migrants before it transitions into improved output, or it might reflect the switch to the low-productivity services sector as the driver of economic growth, or it might just be mismeasurement.
The RBA’s own forecasts imply labour costs will be falling
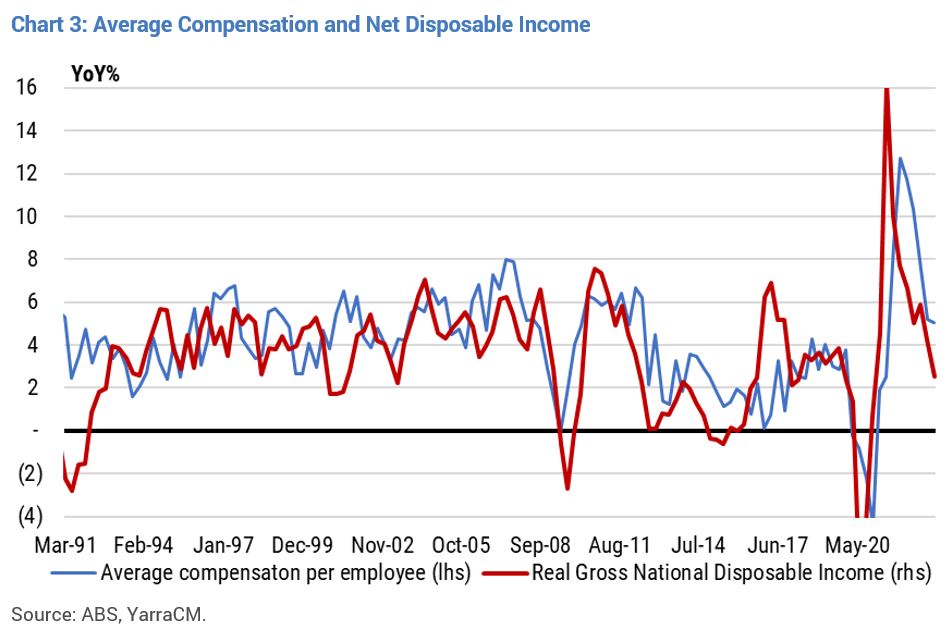
A final point on labour costs and the RBA’s own projections is worth making. Australia has an interesting feature that is somewhat harder to detect in other countries. Labour costs tend to reliably lag by around six months the movement in real gross domestic income (which is really just GDP but calculated using nominal exports less imports to account for the terms of trade effects rather than real exports and imports). The rationale is that the terms of trade effect on profits, orders, employment, taxes paid and wages is so powerful that a reliable rhythm is established between real gross domestic income (RGDI) growth leading labour cost growth. The relationship is shown in Chart 3.
Interestingly, RGDI is suggesting that average labour costs will continue to slow in the next six months.
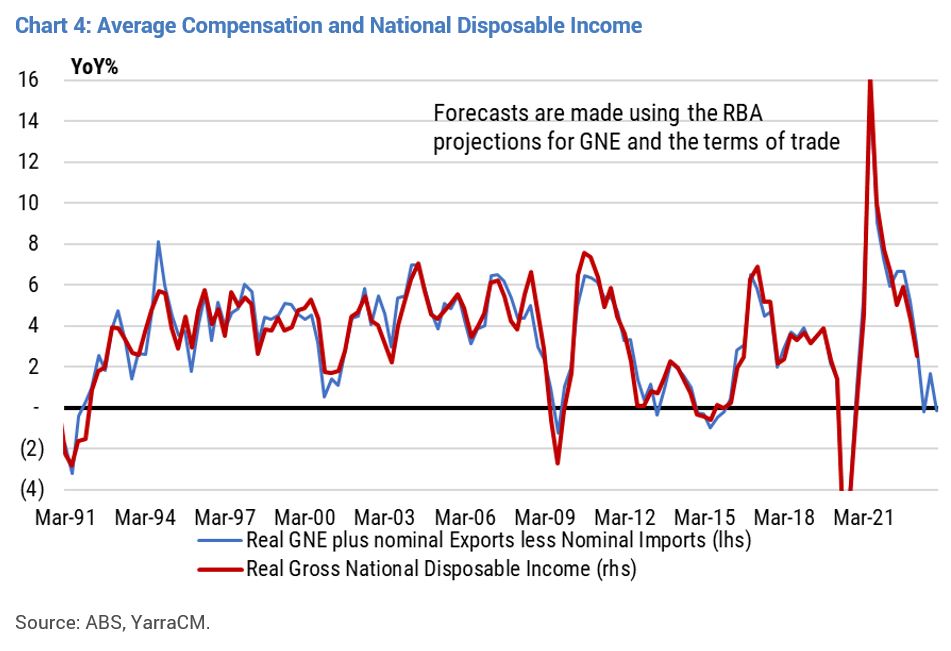
More importantly, if we plug in the RBA’s current forecast variables for economic growth and the terms of trade, we can proxy what RGDI will look like under the RBA’s forecasts. Chart 4 shows that if the RBA’s forecasts were internally consistent, they should be talking about a likely sharp moderation in labour costs over the next 12 months rather than stoking fears that labour costs are too high, and workers are too lazy. Indeed, Chart 4 suggests that even if productivity maintains it recent suspiciously low reading, unit labour costs will still decline under the weight of slowing average labour costs.
What about the other ‘new’ reasons cited for hiking?
The RBA also made reference to services inflation overseas, house prices and a weak AUD as additional reasons for hiking in the past two months. One must also question why any of these reasons were sufficient to warrant more than passing comment, let alone additional hikes.
Firstly, the AUD is unchanged from mid-2022 on a TWI basis and as such has made no difference to broader financial conditions.
With respect to house prices, policy makers typically care about rising house prices because of the wealth effect on consumption or because it signals loan growth might accelerate to an excessive level. The wealth effect is typically small at the best of times, but a small rise in house prices leaves them well down from their peak on sharply reduced volumes of sale. That is, the wealth effect from housing is still negative and with the equity market giving up nearly all of its gains for 2023 there is no offset from financial wealth. Moreover, it’s clear that consumption trends are already slowing sharply so a sustained rise in house prices would do little to alter the demand picture in 2023-24. With respect to loan growth, housing finance has fallen by more than 25%yoy and housing credit growth of 5%yoy is set to slow towards 3.5%yoy if the 0.3%mom pace of the past 5 months is sustained. Both consumption and housing finance are undershooting expectations. There is no rational reason to suggest that house prices rising a few percent in the current environment would warrant interest rate rises.
Lastly, and perhaps the strangest rationale, is the focus on services inflation in other countries as a reason to hike rates in this country. The reality is that inflation is mostly driven by services most of the time. Energy, food and goods can at times provide additional inflationary and deflationary pressures to the economy, but the services sector is always the dominant source and constant provider of inflation. The reason is because around 80% of what determines services inflation is wage costs and the remainder is mostly government administered prices. In Australia, the source of recent services inflation is government administered prices – rates, utilities, health care and education. In the US, UK and even in Europe it has been more about excessive wage growth. Yet even if we were concerned about services inflation taking root via an offshore trend, the reality is that US services inflation peaked several months ago. Moreover, there is no evidence that stickier services inflation overseas has transitioned into higher long run inflation expectations offshore let alone why Australia households would alter their expectations.
Non-linear responses to shifts in policy framework and buying more bonds
Frankly, whether its ULCs, house prices, the AUD or services inflation in other countries the RBA is either guilty of shallow analysis or it is searching for excuses to hike. Is the current Governor attempting to get all the hikes out of the way in order to provide some white space for his successor, assuming he is replaced (the decision on his future is pending late this month or early July)? We maintain that the RBA should have already finished the hiking cycle, albeit shifting goal posts and questionable analysis suggest a further hike cannot be ruled out.
The trouble with pushing rates up further at this point of the cycle and flagging more hikes ahead clearly risks a hard landing. This is reflected in our portfolio construction. We are significantly overweight fixed income and have added duration in our multi-asset products until central banks come to their senses and realise that searching for new reasons to incrementally hike rates when demand is already faltering risks painful, non-linear real economy outcomes.