


By Dr Erin Kuo-Sutherland (Chief Sustainability Officer) and Ed Waller (Deputy PM, Ex-20 Equities).
Data centres are now the fastest-growing new source of electricity demand in Australia and a rising claim on urban water. Clients ask us a version of the same question: is AI genuinely an environmental problem, or one that technology will solve? Our answer is that it is partly both, and that the national figures used on either side of the argument cannot settle it. Water intensity varies more than two hundred-fold between cooling designs, and whether a facility is limited by water or by power depends on which design it uses. That variation — not the sector average — is where both the risk and the opportunity sit.
Two arguments, both using the wrong numbers
The debate has settled into two positions. One holds that AI infrastructure is an unsustainable claim on scarce water and power. The other, offered by the industry, is that data centres use only a fraction of national water and that innovation will resolve the rest. Both positions rely on national aggregates, and aggregates fail here for two reasons. First, water and grid capacity are local, so a national share tells us nothing about the catchment or substation under pressure. Secondly, the facilities are not alike: two data centres of identical size can differ by a factor of two hundred in how much water they consume. We set out the broader ESG dimensions of AI earlier this year; this note goes deeper on the resource question, which is the one our clients now raise most often.
How much is actually being built?
Australia has 162 operating data centres and approximately another 90 in development, with the current generation of data centres supporting AI deployments now a multiple in size of prior generations. Roughly 80% of capacity is in Sydney and Melbourne[1], and in New South Wales alone the development pipeline at 31 March 2026 stood at 44 facilities totalling 11.4 GW.[2] Anthropic is reported to be seeking a campus of more than 1.4 GW, with a request for proposal issued to five shortlisted developers and a target of at least 1 GW operating by the end of 2027 — a project estimated to require between US$12 billion and US$15 billion in debt and equity financing.[3]
Actual energy consumption is far smaller. Data centres used approximately 4 TWh in FY25, representing close to 2% of National Electricity Market (NEM) demand, which AEMO expects to roughly triple to 12 TWh, or about 6% of NEM, by 2030.[4] The pipeline is not the forecast, and the gap between them is the most important number in this debate. AEMO has received around 44 GW of connection requests but expects only about 6 GW to be built (refer Fig 1).
Figure 1. Data centre connection requests far exceed expected load
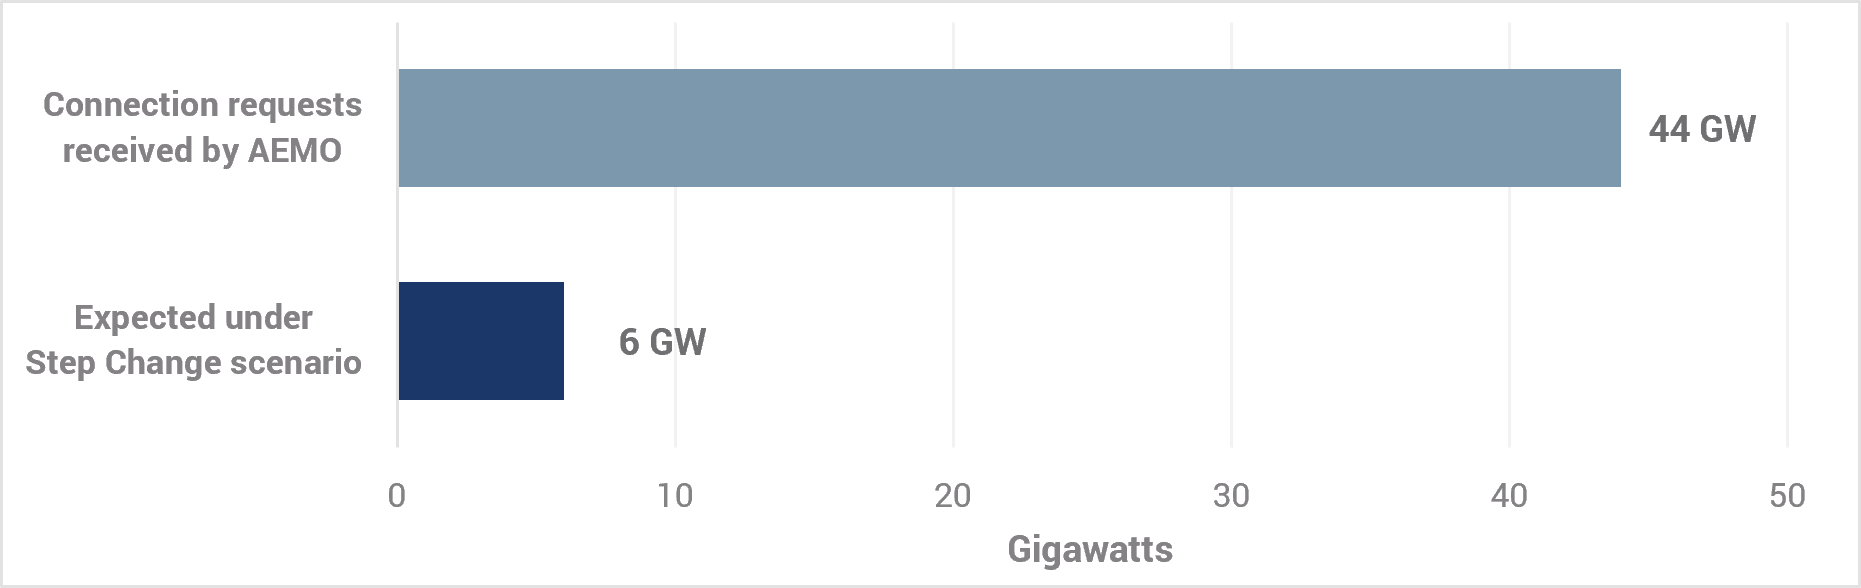
Source: AEMO connection request data as reported by the Climate Council (June 2026); Step Change scenario, AEMO Integrated System Plan.
The reasons for this gap are reasonably straightforward. Developers apply for grid and water connections at several sites before deciding where to build, meaning that one individual project can appear several times in the queue. As hype around the data centre space has risen, the number of highly speculative projects from proponents with limited track records, that are unlikely to get built, has also jumped. Around half of announced projects are withdrawn or scaled back each year, and existing facilities run at between 27% and 37% of capacity given generally long ramp up periods.[5] Water utilities see the same pattern: applications for individual sites drawing between 5—40 million litres a day, as much as 20-times their largest existing drinking-water customer, which are clearly applications rather than commitments.[6] The sector will grow, but by less than the pipeline suggests.
The water pressure is real, but it is local
Nationally, data centres use very little water. Industry-commissioned analysis puts direct on-site use at about 5.5 gigalitres a year, roughly 0.04% of national consumption.[7] That figure is accurate, yet it is the incorrect measure since roughly two-thirds of Australia’s 17.6 million megalitres of annual industrial water use goes to agriculture, forestry and fishing. A national share therefore mostly describes irrigation.[8]
The pressure is concentrated where the facilities are, in fast-growing outer suburbs whose drinking-water networks are already stretched.[9] Sydney Water estimates data centres could take 15–20% of Sydney’s supply by 2035, and has told a NSW parliamentary inquiry that cumulative demand could reach 250 million litres a day under a high-growth scenario.[10] In Melbourne’s west, 19 proposed facilities have sought around 20 gigalitres a year between them — enough to supply more than 330,000 residents.[11]
Nationally, direct use could rise from about 5.5 gigalitres to around 17 gigalitres annually. The baseline is industry-commissioned and the forecast is the Climate Council’s, and both are built from the same connection applications that overstate the energy pipeline. Industry modelling suggests more modest numbers, while the utilities sector forecasts something starker. In reality, both can be true.[12]
The constraint depends on the design
A data centre is not one thing. Disclosed water usage effectiveness (WUE)— litres of water consumed per unit of computing energy — ranges from about 0.01 to 2.25 across operators serving this market. Put another way, a facility at the low end uses roughly 200-times less water than one at the high end to do the same work.[13]
Part of the difficulty for investors is that operators generally only disclose a portfolio level WUE. Because WUE diverges greatly based on an individual data centre’s design, use case and utilisation level, portfolio level WUE disclosure is not particularly helpful. Disclosure at the site level would be far more instructive. However, operators have a defensible reason to resist site-level disclosure — the figures reveal customer activity and how heavily a facility is used — and blended averages penalise whoever builds fastest, since new sites take 3-5 years to reach design performance. No operator chooses to move first when moving first could exposes customer information.
That range of data centre WUE comes from a single engineering decision: how the building sheds heat. Evaporative cooling uses water, which evaporates as it carries heat away — efficient on power, heavy on water. Closed-loop and dry-cooler systems recirculate coolant that is never lost to the air, using almost no water. On current-generation equipment, these systems require 10–15% more electricity for the same computing, since the coolant must be held near or below ambient temperature.[14]
The two designs therefore hit different limitations, and operators have told us that directly. A closed-loop operator identified transmission access as the binding constraint on growth, with water largely solved. An operator running mostly evaporative cooling described water as its biggest constraint, principally through social licence and rising cost. Both are correct about their own specific challenges.[15]
Terminology obscures this. “Liquid cooling” describes two different things: (1) systems that use evaporative cooling to carry heat away from the chip, continuously consuming water; and (2) closed-loop systems that consume water once and then recycle that water. Public debate rarely separates them. Neither does most disclosure.
Figure 2. Water intensity varies by more than two hundred-fold across cooling designs

Source: Refer Footnote 14.
Will technology solve the challenge?
Partly. AI workloads tolerate higher operating temperatures than earlier computing, which reduces the need for evaporative cooling. Operators are already persuading customers to lift temperature limits by two degrees, and customers are supportive, in part since it helps with their own emissions targets.
The larger change is at the chip level. NVIDIA’s Vera Rubin series is specified to run on coolant supplied at 45°C, against an industry standard nearer 30°C, allowing heat to be rejected through dry coolers rather than evaporative towers. The vendor claims close to zero water consumption on that basis; an operator we engaged put a realistic facility outcome nearer 0.1 L/kWh. Unusually, this is not the familiar water-for-energy trade — removing the chiller plant cuts a large electricity load, so water and energy performance can improve together.
Two qualifications matter here. First, it is an evolution rather than a break, since the previous generation already accepted coolant at 40°C. Second, Australian conditions sit close to the limit, and the growth corridors where new capacity is concentrated are inland rather than coastal. Penrith, in the western Sydney corridor, reached 48.9°C in January 2020 — the highest temperature recorded at any Australian capital city weather station — and Melbourne has reached 46.4°C. Once heat-exchanger and pump losses are counted, ambient conditions can approach or exceed the 45°C inlet requirement on design days, so mechanical chilling is still required at peak. The design reduces chiller hours rather than removing chillers. That is a real path, and it is why we think the alarmed version of this story overstates the long-run challenge. But it only applies to new builds. Existing evaporative facilities have long asset lives and are expensive to retrofit, so improvement arrives at the pace of the build cycle rather than the chip cycle.
The most-cited alternative, recycled water, is slower than it sounds, and the obstacle is utility investment rather than operator willingness. One flagship Melbourne site may wait 6–8 years after opening for recycled supply to reach it. Nor does a regulated price path give operators much certainty: in its 2025–30 determination the NSW pricing regulator, IPART (Independent Pricing and Regulatory Tribunal), chose to continue deferring price-setting for Sydney Water’s recycled water schemes, meaning there is no determined price for recycled supply as yet in Greater Sydney. Victorian schemes sit under a separate regulator again.[16]
Where you invest in the value chain determines your exposure
Water risk does not sit evenly along the chain. The operator chooses the cooling design and carries direct exposure to water intensity, pricing and compliance capital expenditure. The developer-landlord does not run cooling systems; its exposure comes through planning conditions, infrastructure contributions and physical risks (e.g. flood). An equity holder in an operator inherits that operator’s design choices. “Data centre exposure” describes three materially different risk profiles.
Figure 3. Water risk exposure by position in the data centre value chain

Source: Yarra Capital Management Water Risk Framework (2026).
What the recent AI policy announcement does, and where it stops
On 15 July 2026 the Government announced an Office of AI within the Department of the Prime Minister and Cabinet, alongside standards requiring large AI data centres to be net producers of energy: underwriting new power supply, returning at least as much energy to the grid as they draw, paying for grid connections and additional water infrastructure without passing costs to consumers, minimising water use, and reducing load when the grid is strained. National Cabinet endorsement is being sought at the time of writing, with legislation targeted for early 2027.[17]
Three qualifications matter:
- Curtailment is not new: operators can already be required to be off the grid during peak demand and are paid for it, so the obligation formalises existing practice.[18]
- “Net producer” is undefined in practice, and Ireland is the closest benchmark: new connections there require on-site generation or storage matching import capacity, the ability to export to the grid, and 80% additional new-build renewables within six years[19]; and
- State settings are diverging: at the Energy and Climate Change Ministerial Council on 28 July, Queensland and the Northern Territory opposed the AI Standards and the commitment to legislate national requirements; the other six jurisdictions supported them.[20]
A framework for investors
Clients ask whether it is possible to gain exposure to AI infrastructure without funding a water and energy-hungry asset. The answer depends on which point in the chain the exposure lies, since each point can carry very different resource footprints.
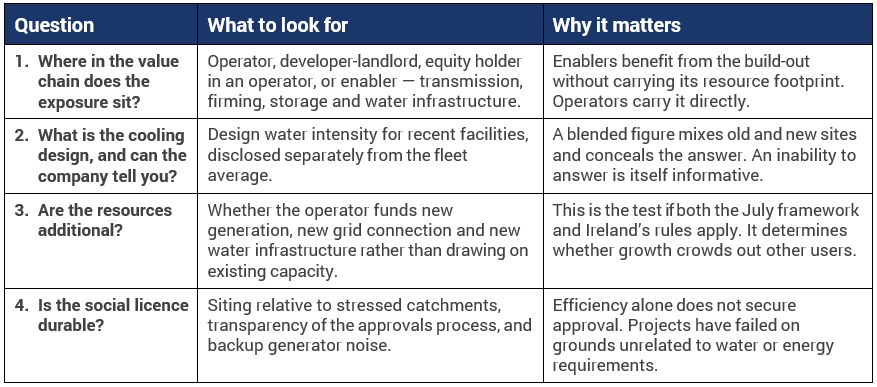
The answers to these questions can be both difficult to obtain and are not necessarily predictive of the outcome. An investor cannot currently answer the second question – cooling design – from public disclosure alone, which is why we engage directly. On the topic of social licence, efficiency does not buy approval on its own, with a multitude of other community concerns.
It is also important to go to the second and third layer of detail when assessing the answers to these questions. For instance, a closed-loop operator has not removed resource intensity but traded water for power, and generating that power consumes water of its own, meaning part of the saving is displaced rather than eliminated. Water intensity also says nothing about whether a facility draws on drinking supply or recycled water, and the source matters as much as the volume.[21]
What we are watching for
- Whether “net producer” carries an additionality requirement comparable to Ireland’s.
- Attrition in the connection queue, which represents the best available signal on how much of the 44 GW is ‘real’.
- Progress toward a mandatory water metric, and whether it requires disclosure by site and by facility vintage.
- Customer concentration behind long-dated leases, since neocloud tenants take a larger share of demand.
Examples of company engagement questions
- What is the design water intensity of newer facilities, reported separately from the fleet average?
- Where cooling design differs across a portfolio, what would a retrofit cost and what is the payback case?
- Is water access a formal criterion in site selection, and at what stage of the process?
- If recycled water is planned, who funds the infrastructure? And what happens if the utility’s capital programme slips?
- Where is the power being sourced and how is the renewable component being firmed?
- Is it viable to offset the carbon intensive electricity that is being used?
- Can the project meet a standard of electricity additionality comparable to Ireland’s standard?
- If waste heat is being produced, is there a plan for reuse or capture of that waste heat?
+++
[1] Australian Data Centre Forecast Report, Issue 1 (April 2026): Clouded Future: Managing the Risks of the Data Centre (June 2026).
[2] Climate Council (June 2026), NSW development pipeline as at 31 March 2026.
[3] Australian Financial Review, citing confidential tender documents, July 2026.
[4] AEMO data as reported by the Climate Council (June 2026); AEMO, Electricity Statement of Opportunities 2026.
[5] AEMO project attrition and utilisation estimates as reported by the Climate Council (June 2026).
[6] Water Services Association of Australia, Data Centres and Water in Australia (December 2025).
[7] Mandala Partners, Data Centres as Enabling Infrastructure.
[8] ABS, Water Account, Australia (2023-24 release).
[9] Water Services Association of Australia (December 2025).
[10] Sydney Water evidence to the NSW Legislative Council inquiry into data centres.
[11] Greater Western Water and industry analysis of proposed facilities in Melbourne’s west (2026).
[12] Baseline of approximately 5.5 GL from Mandala Partners (industry-commissioned); forecast of approximately 17 GL from Climate Council, Clouded Future (June 2026). Both derive from connection applications rather than confirmed demand. Synthesis drawn from M. R. Hosseini, “What AI data centres really mean for Australia’s water supply”, July 2026.
[13] Water usage effectiveness (WUE): litres of site water consumed per kilowatt-hour of IT equipment energy. Sources: data centre operator FY25 sustainability disclosures; company statements reported in NZ Herald (August 2024); Australian Energy Council, Data Centre Sustainability Briefing (2025). Figures are not prepared on a common basis: some operators report normalised WUE (net of recycled or non-potable supply), others gross; reporting periods range from 2024 to FY25; and fleet-blended averages combine facility vintages, with new sites typically requiring three to five years to reach design WUE. Australia has no mandatory WUE reporting standard and no WUE threshold has been set; NABERS water reporting applies only to government-controlled facilities, while the EU Energy Efficiency Directive requires reporting to a central database.
[14] Yarra Capital Management engagement programme, 2025-26, comprising management, board and site-level meetings with Australian data centre operators, developers and investors.
[15] ibid.
[16] Yarra Capital Management engagement programme, 2025-26; IPART, Sydney Water prices 2025–2030, Final Report (September 2025). IPART regulates New South Wales; Victorian water businesses are regulated by the Essential Services Commission.
[17] Prime Minister of Australia, “AI in Australia’s Interests”, 15 July 2026; Department of Industry, Science and Resources (March 2026).
[18] Yarra Capital Management engagement programme, 2025-26.
[19] Commission for Regulation of Utilities (Ireland), revised data centre connection policy, 2025.
[20] Energy and Climate Change Ministerial Council communique, 28 July 2026; Minister for Climate Change and Energy, National Press Club address, August 2026. National Electricity Rule change requests are scheduled for consideration in September 2026.
[21] Water Services Association of Australia (December 2025).



0 Comments