The March quarter National Accounts might seem dated, having missed much of the drama associated with the oil price shock, RBA rate hike in May and of course the May Budget. Nevertheless, it does provide the most complete report card for how the Australian economy was positioned going into those series of key economic events and, together with recent updates on inflation and the labour market, some important conclusions can be drawn.
We have been somewhat at odds with the RBA and most of the economic commentariat over the past six months. Our contention has been that the Australian economic growth momentum peaked in November 2025 and entered 2026 with failing momentum. We obviously acknowledged the impact upon headline inflation from the oil price shock, the last vestiges of the lapsing of the electricity subsidy and the outlandish contribution to inflation from taxes such as the tobacco excise and property charges provided.
However, we maintained there was scant evidence of a broad-based pick-up in inflation and that the starting proposition of policy makers that the Australian economy was operating with a large positive output gap was more open for debate. We argued that financial conditions were already tight by February and that further tightening would risk an unnecessarily excessive slowdown in activity. And we maintained that the labour market would likely show demonstrate greater weakness through 2026 than the RBA forecasts suggested.
The latest round up of economic and survey data reveals the unemployment rate rising sharply, some of which may be due to the survey period over Easter, a monthly CPI print for April that continues to demonstrate remarkable stability with the monthly trimmed mean rising from 3.3% to 3.4%yoy, and clear indications from the economy had lost momentum in 1Q, long before the full effects of the Iran conflict have been captured in the data.
Economic growth expanded at just 0.3%mom in the March quarter of 2026 and declined in per capita terms. Booming data centre capex (machinery and equipment investment contributed 0.7% to economic growth in the quarter) was a dominant theme in the GDP report, however the associated imports (which subtracted 0.5%qoq from economic growth) were also large. The net impact of just 0.2% confirms the thesis that the net economic benefit from the surge in AI investment is modest, at least during the initial capex phase. It is simply hard to escape the conclusion that the economy’s 2.5%yoy over the year to March is currently running a little below the RBA forecast tracking into midyear, however, the combination of persistent shocks via a drawn out Iran conflict, tighter financial Australian conditions and a new shock via the Budget suggests a more material slowing in economic growth is in prospect.
Chart 1. NAB Business survey vs. domestic demand
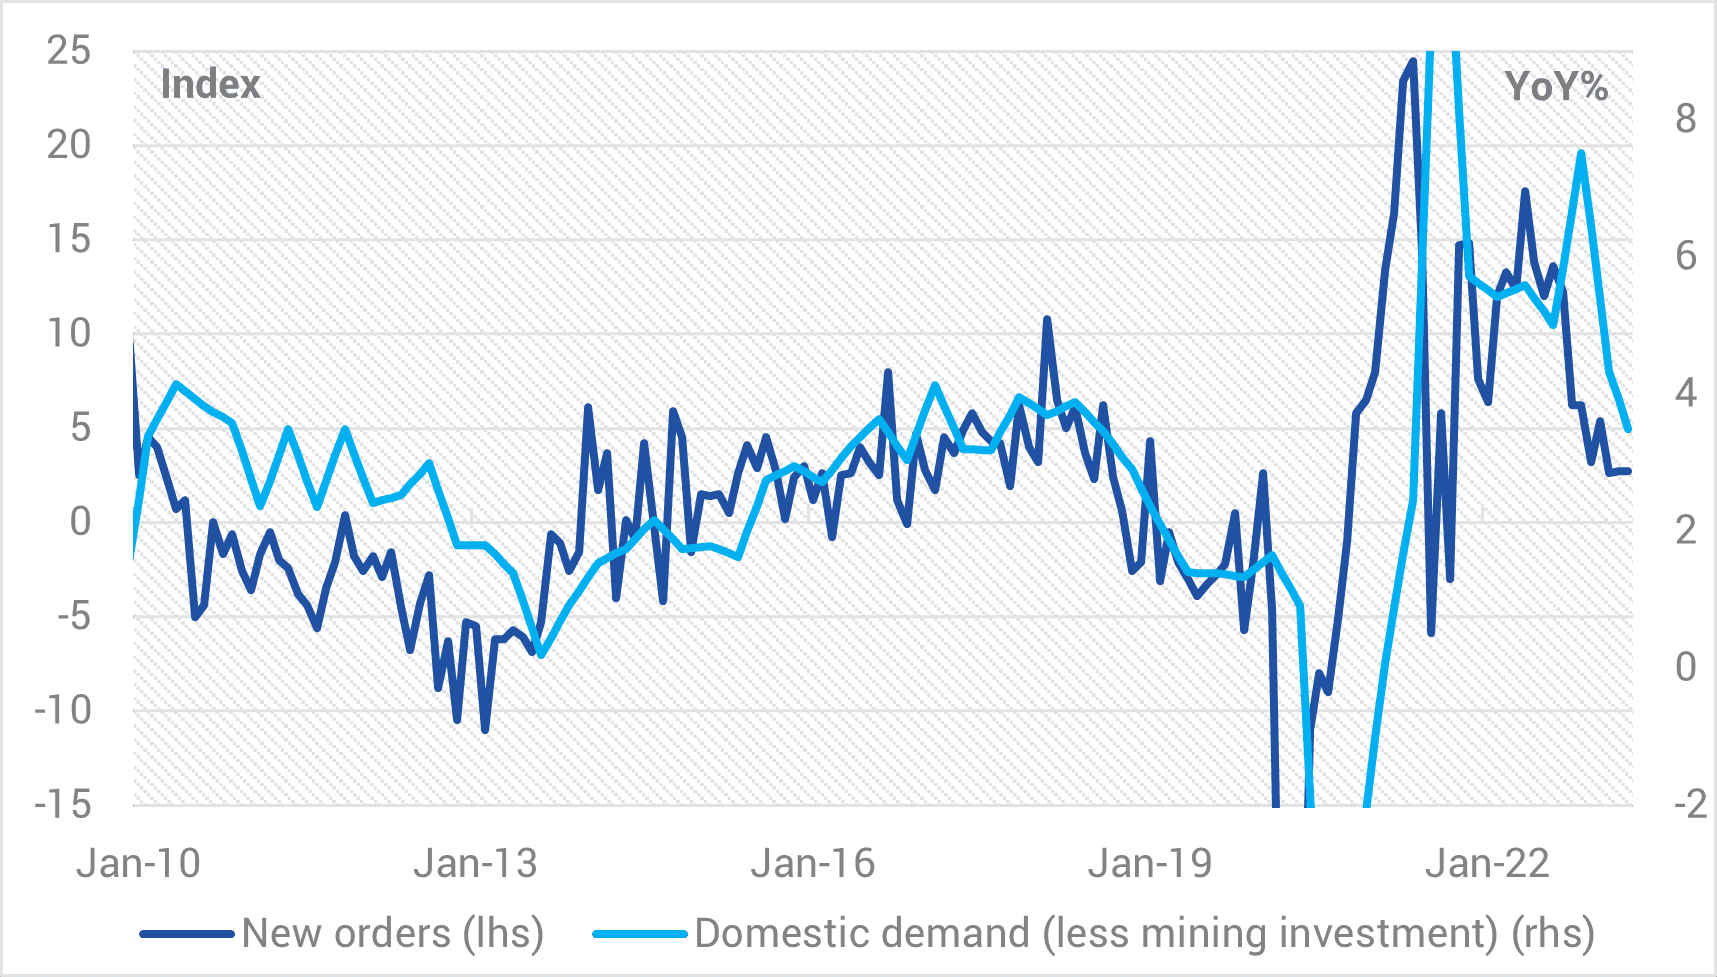
Source: YCM, NAB, Jun 2026.
The NAB survey of business forward orders was consistent with the slowing in economic growth that we have already witnessed, however, it is worth noting that forward orders tend to follow business confidence with a lag.
Chart 2. NAB Business forward orders and confidence
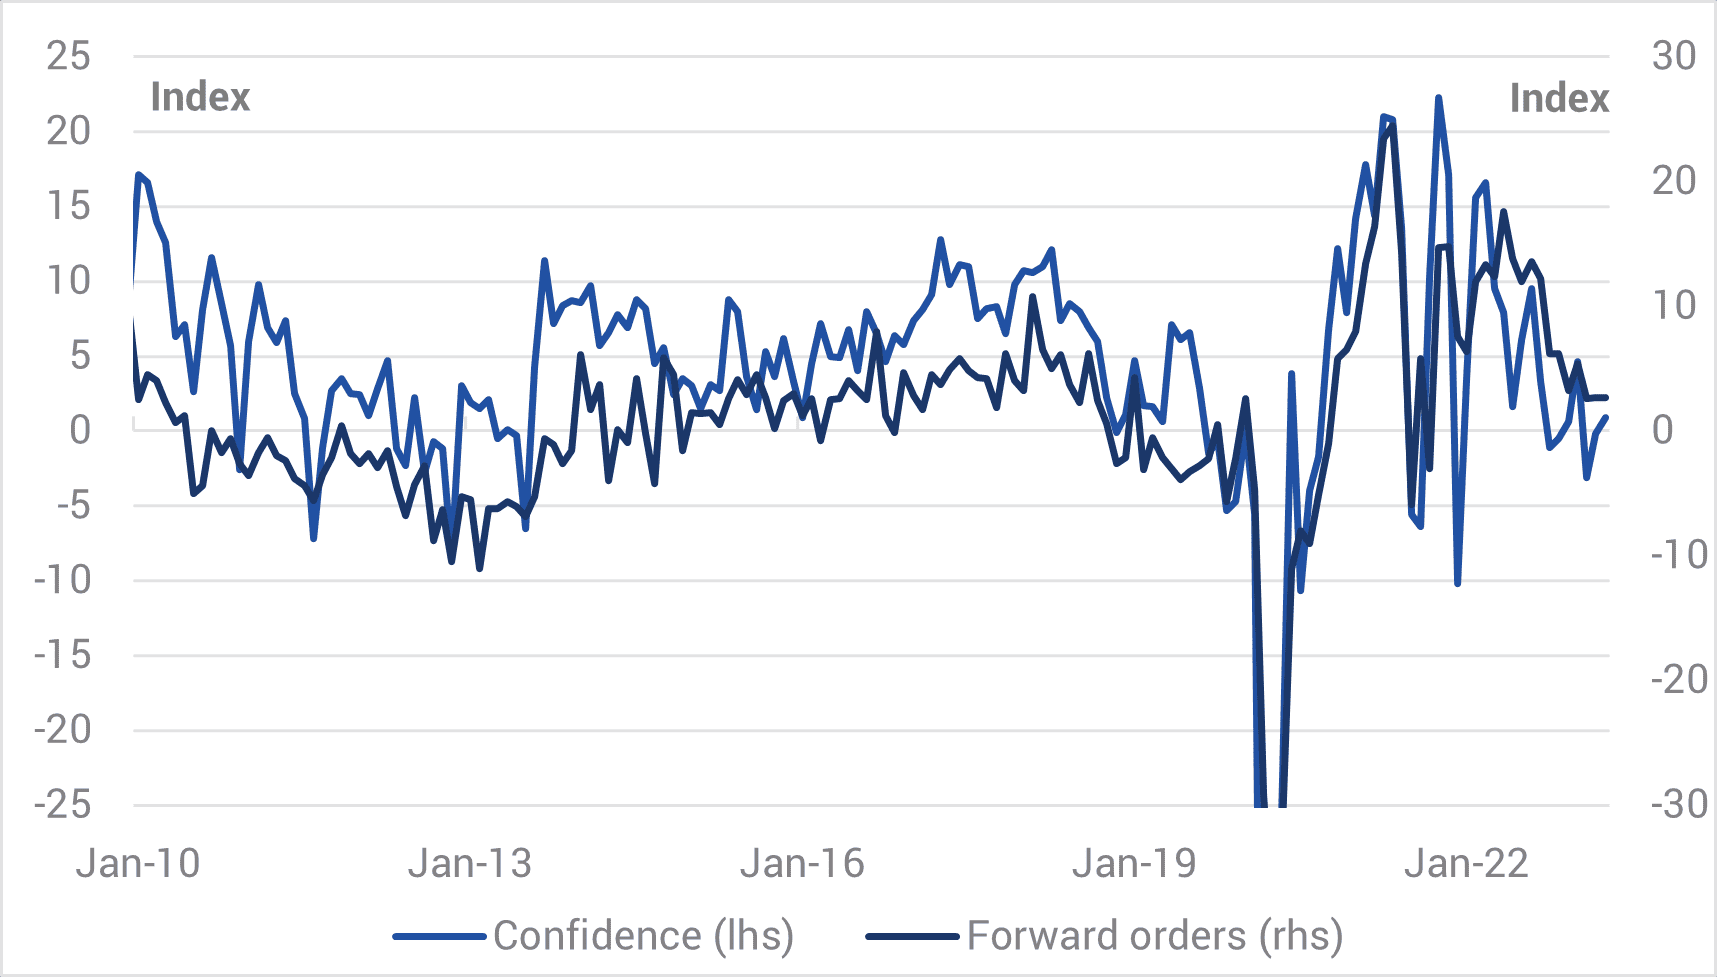
Source: YCM, NAB, Jun 2026.
Given the reception business leaders have given the Budget, it is likely that business confidence for May and June will likely be in broad based retreat, representing a likely stepping stone to weaker realised economic growth in coming months.
Our calculations on the impact of the removal of negative gearing and a change in CGT dramatically alter the economics for a residential investor in established investment property. At an average income tax rates of 32% the internal rate of return (IRR) drops 1.5% (assuming 6%pa house price growth, 2.5% inflation and a 10-year holding period) and for a top marginal taxpayer the IRR drops 2.25%. The lower the assumption for inflation and the higher the assumption for capital growth the worse it is relative to the current system. Importantly, the loss of deductibility of interest also interacts with the calculation of borrowing capacity, reducing it by between 8-15% for most circumstances. This is important given investor credit is 40% of the share of mortgage lending and substitutability to new investment properties will likely be small, especially when house prices are in decline. The inference is that housing credit growth which was already slowing in response to slowing housing turnover could plummet in coming months. Excess credit growth was one of the reasons quoted by the RBA for recent rate hikes. It seems the Budget has well and truly fixed that problem for the RBA!
Chart 3. Real Economic Growth
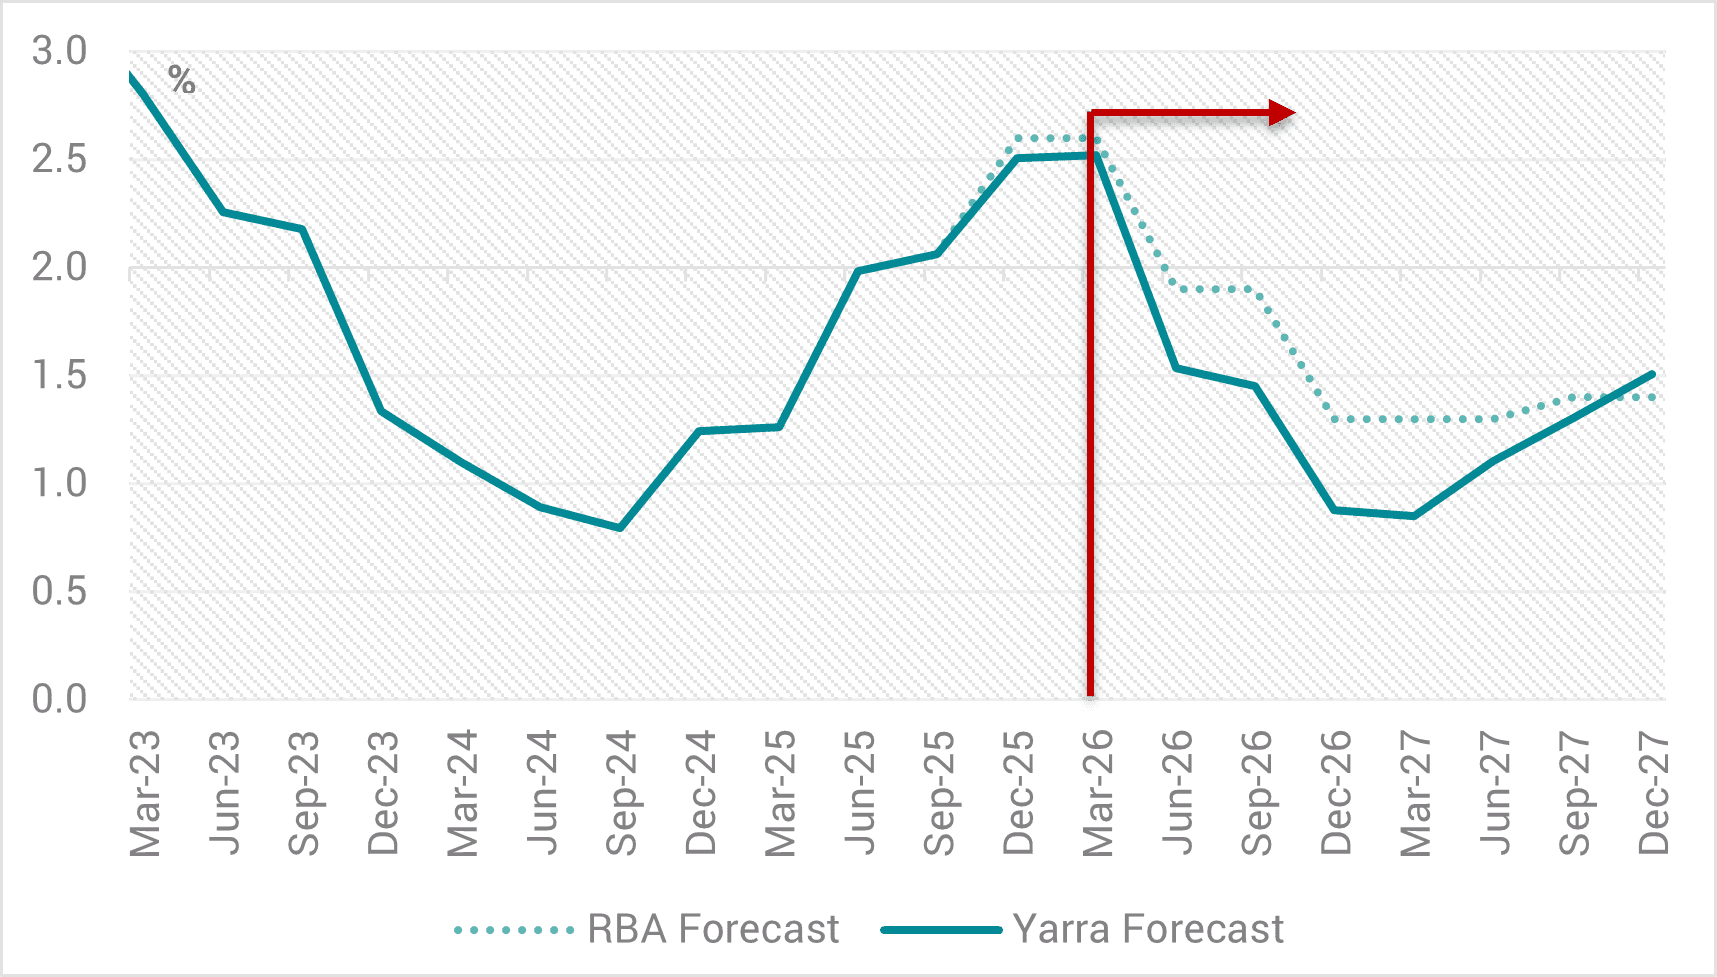
Source: YCM, ABS, RBA, Jun 2026.
The RBA was forecasting weaker economic growth; however, we think that they will now be in downgrade mode during most of 2026-27. Given the unemployment rate is already running 18 months ahead of the RBA’s forecast, weaker economic growth will require the RBA to ratchet up their forecast for the unemployment rate.
On our estimates the GDP data confirm the Australian economy’s supply and demand expanded in roughly equal proportion over the past 12 months. Over half of the realised economic growth has come via expanding the capital stock via new investment and ongoing strong population growth has simultaneously expanded the pool of available labour. Unit labour costs remain too high at 4.2%yoy, but they are slowing and they are well below the 5.7%yoy pace of 1Q2025 when the RBA was easing interest rates. While we would also like to see higher productivity growth it is notable that 12-month average productivity growth of 0.7% is the highest in four years and this is despite cyclones impacting the highly productive mining sector in the March quarter.
Of course, no one can know with certainty how much AI use will add to future productivity. However, our base case is that over the next two years it will prove to a deflationary force that drives the unemployment rate around 1% higher than base case forecasts and in the process limits wage demands. This doesn’t necessarily mean that economic growth will be lower if productivity is higher. Much will depend upon how we measure AI use in the workforce, which will be an ongoing challenge for the Statistician both here and abroad.
Chart 4. Unemployment Rate
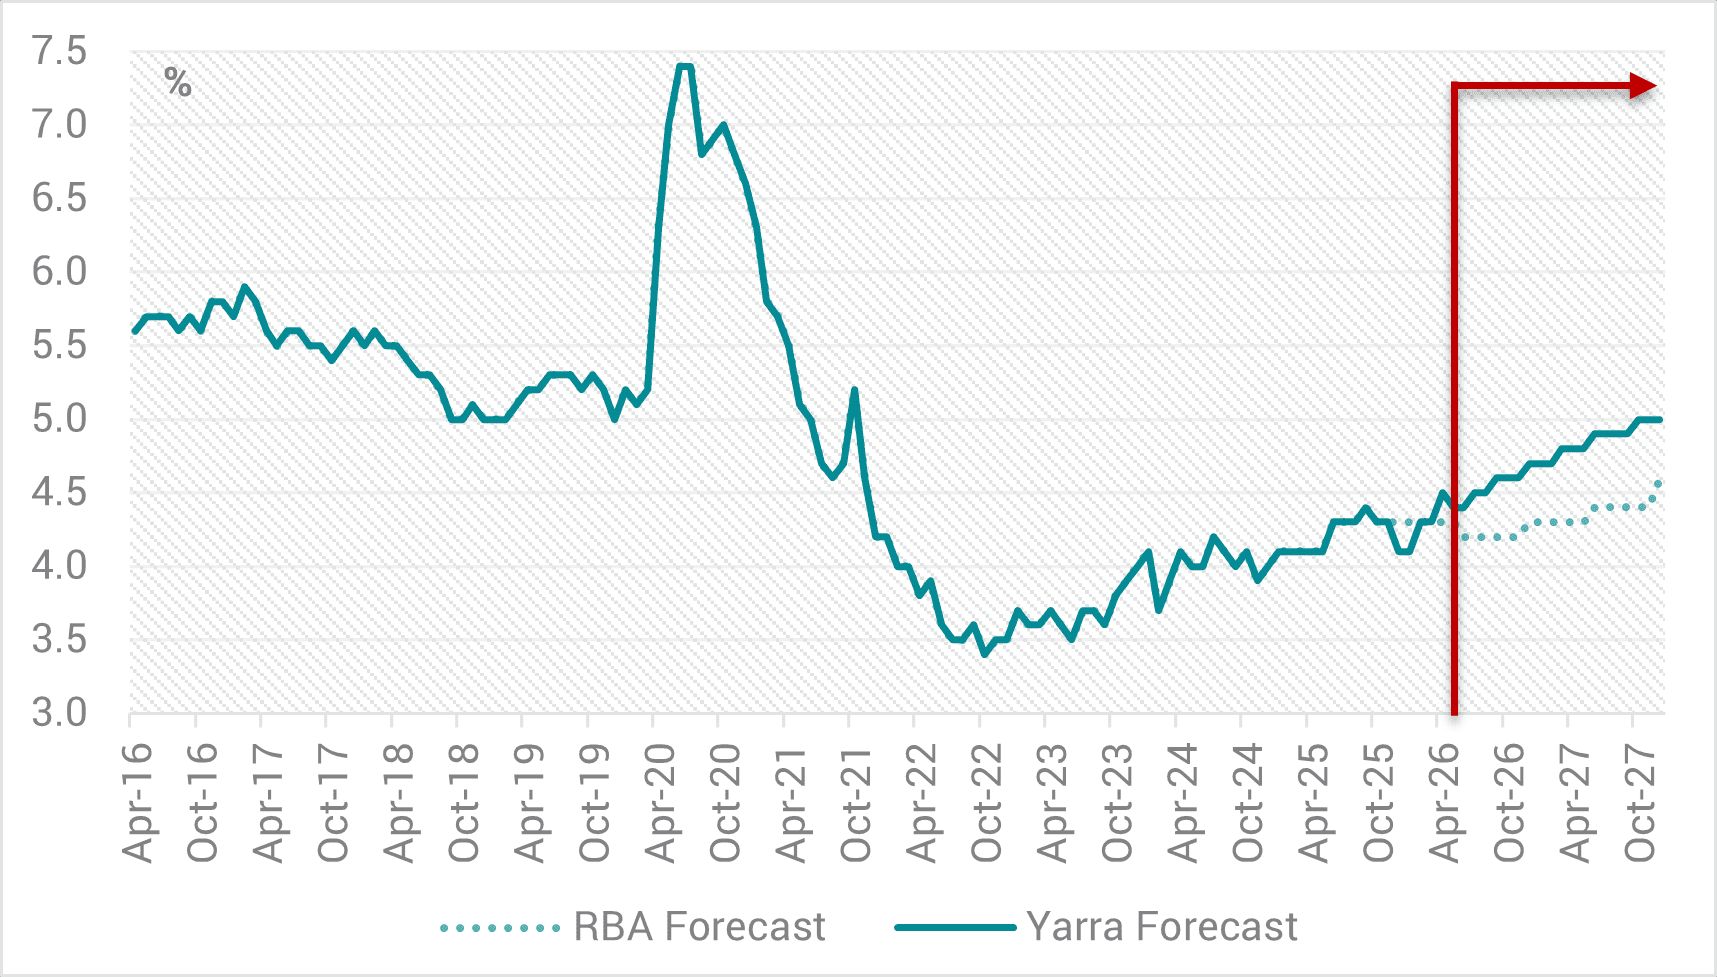
Source: YCM, ABS, RBA, Jun 2026.
If there is one thing that we think we know it is that when the annual change in the unemployment rate is rising the RBA cash rate almost certainly declines. The RBA will continue to look at a wider sweep of labour market data but ultimately it is still the unemployment rate that matters most.
Chart 5. RBA Cash Rate and the Unemployment Rate
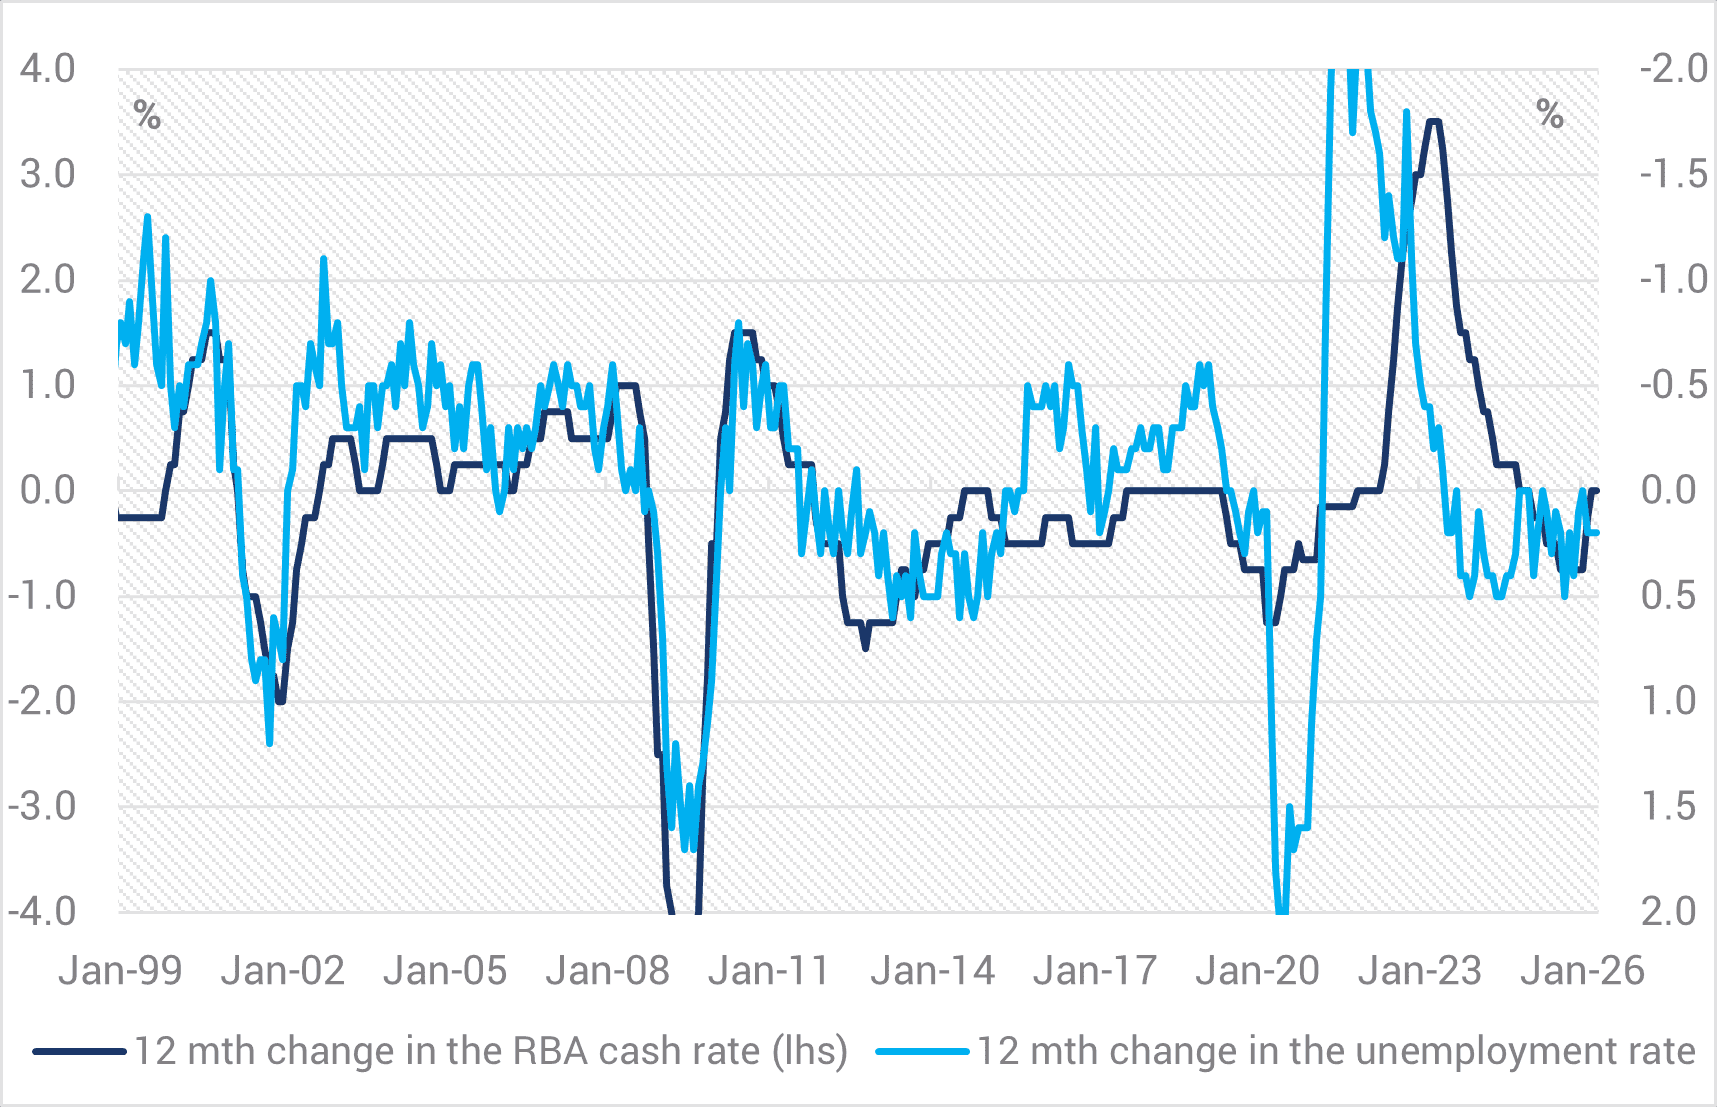
Source: YCM, NAB, Jun 2026.
In the immediate aftermath of the Fair Pay Commission’s decision to lift the modern award by 4.75% and 6% for the very low paid there will be a degree of market concern that this will spill into a wider wage-price spiral. It is true that in sectors such as accommodation and food services, administrative services and retail trade that employers will feel pressure to pass on the costs, however, it is worth noting that we are talking about 11% of the wage bill and we expect the decision to add less than 0.2% to the WPI in 2H26. The RBA forecast for the WPI will more likely be nudged higher rather than act as a catalyst for wholesale revisions and additional tightening.
Chart 6. Wage Price Index
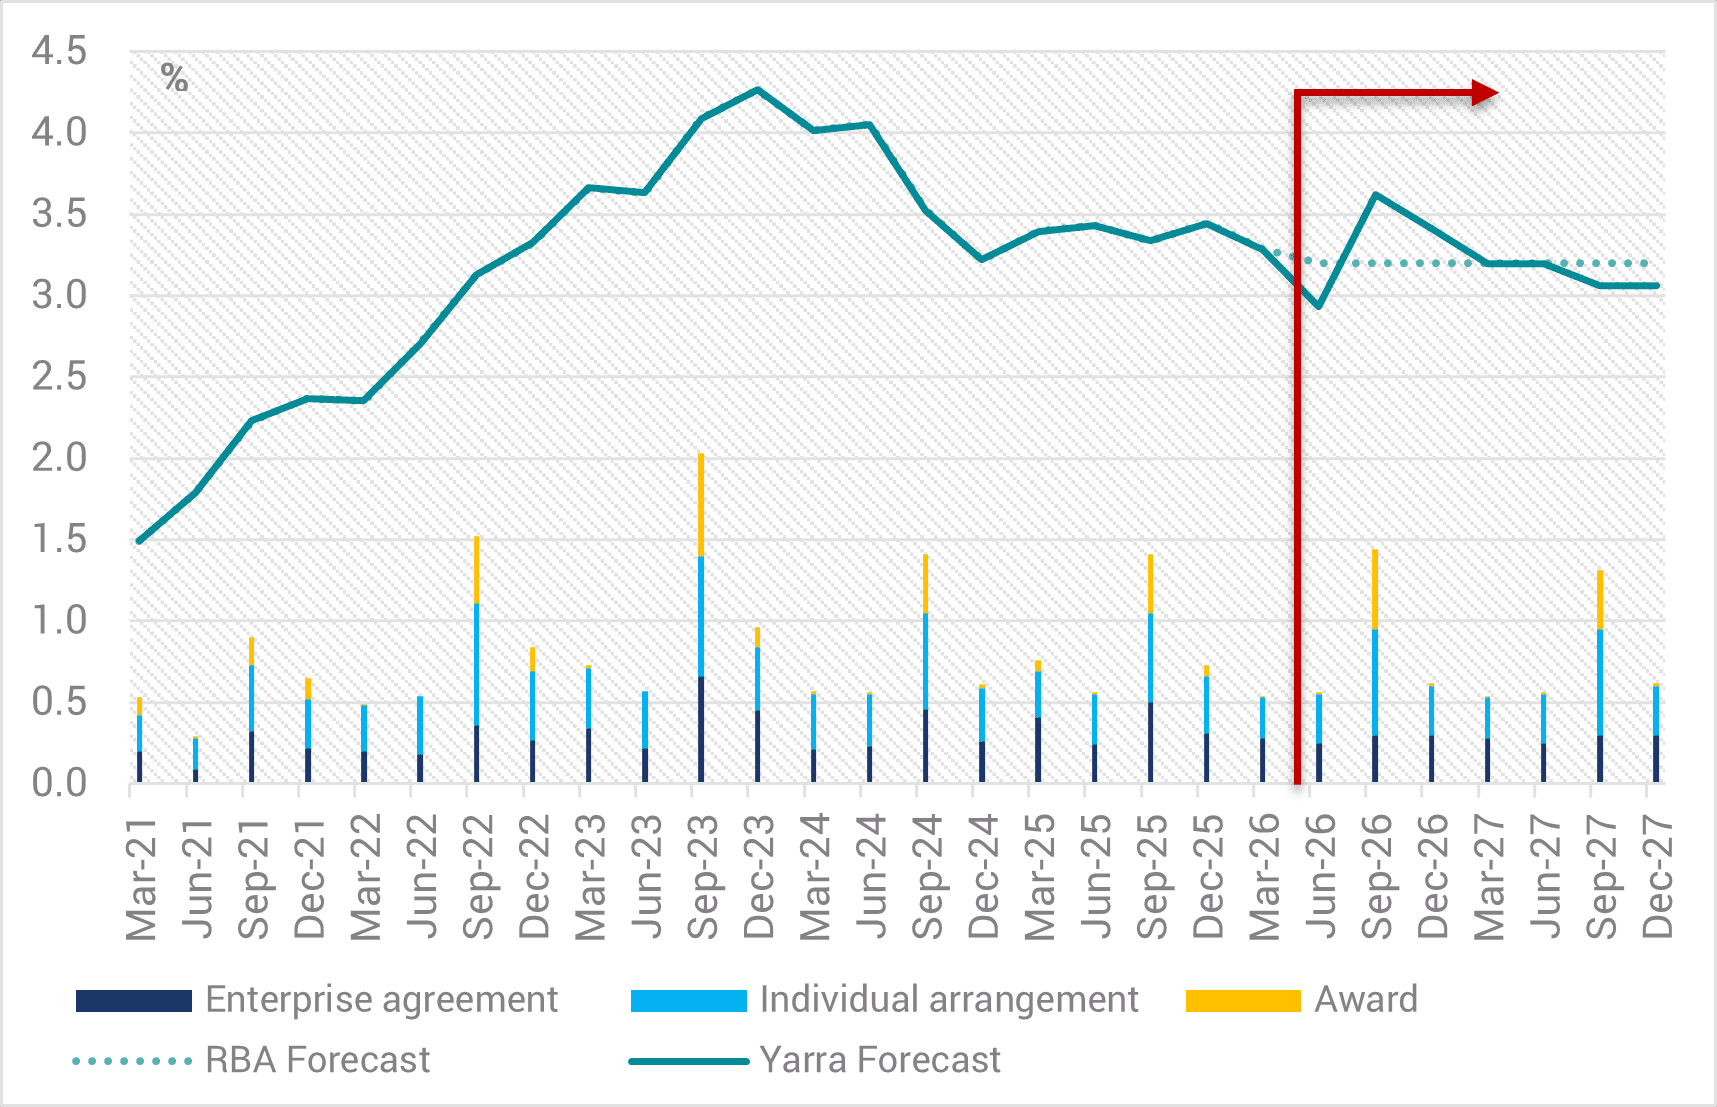
Source: ABS, RBA, YCM, Jun 2026.
As an aside, we watched with interest RBA Board Member Ian Harper’s speech this week. His strong communication skills are an asset that probably could have been on greater display over his many years of association with the Bank. However, his focus on using 3-year inflation swaps as a guide to long run inflation expectations is, to us, a little misplaced. His chart missed a recent decline in the 3-year inflation swap yield in the past week and ignored that 5- and 10-year inflation swaps had barely moved at all. Indeed, Australian 3-year inflation swaps have largely just followed US 3-year inflation swaps through 2026 and long run 5- and 10-year swaps were higher than the current level during the RBA easings of 2025. There is also well-known illiquidity in these instruments in Australia, and the RBA had flagged the limitation of reading too much into these instruments for policy making.
Nevertheless, it is clear that long run inflation expectations are of keen interest for the RBA. We acknowledge that the lack of a cease fire between the US and Iran in coming weeks is a clear risk to a break higher in inflation expectations in coming weeks. However, we would also point to the ABS’s excellent survey of 2900 businesses in the last two weeks of May that showed 40% of firms had not altered their business strategy and 80% of the remaining 60% absorbed fuel and freight costs in margins. Only a small minority of around 6% increased prices. Contrary to fears of ‘dynamic pricing’ it seems the evidence is pointing to cost absorption. It is also worth noting that State Streets widely watched PriceStats data shows Australia as having surprisingly benign inflation trends into the start of June.
Our base case remains that a ceasefire is achieved and oil and inflation expectations move lower through 2H26. In concert with the evolution of the local economic data largely validating our earlier thesis and the clear downside risks to economic growth and the labour market, we maintain that the RBA is unlikely to raise interest rates again this cycle. Indeed, it may have been an unpopular view during 1H26, but we continue to expect the RBA to adopt an easing bias before the end of the calendar year.

0 Comments