If we stop the clock on 2026, the fixed income story of the year is undoubtedly higher yields. Government bond yields in Australia and around the world have been moving upwards in response to higher inflation, with the mid-east war and higher oil prices adding fresh momentum. In Australia, the 3-year government bond yield has pushed out ~30bps since the start of the year (refer Chart 1).
Chart 1. Australian 3-year Government Bonds (%)
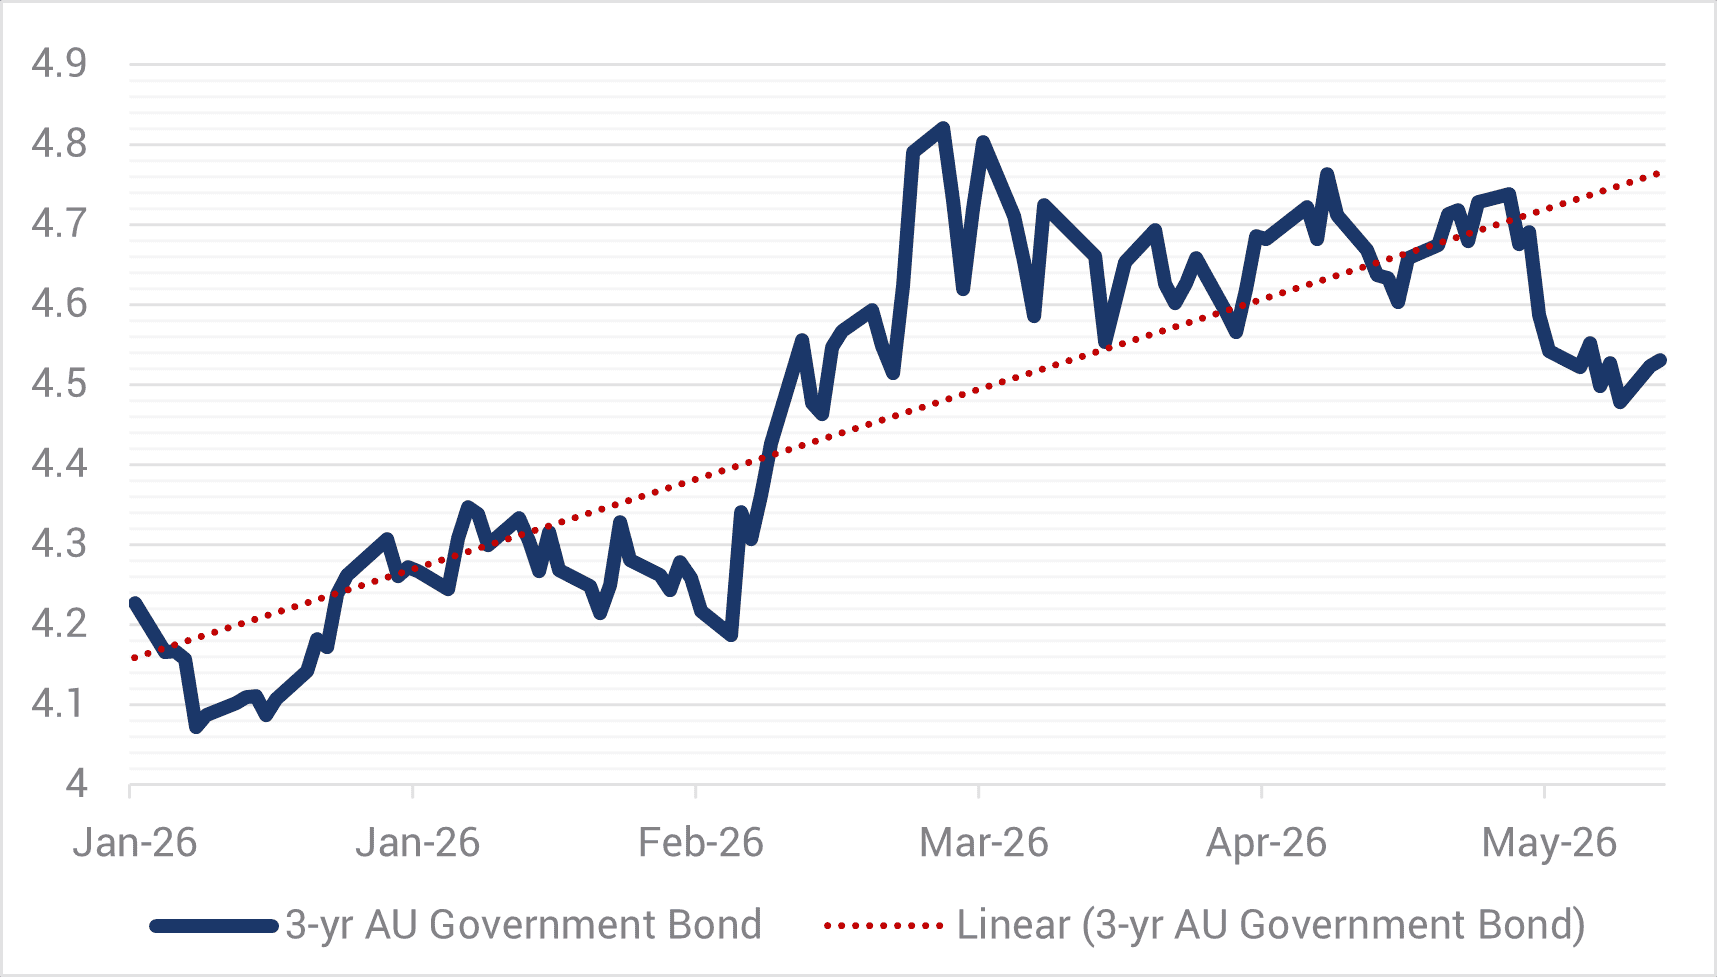
Source: YCM, Bloomberg, Jun 2026.
Despite increased volatility, the Australian primary issuance market has remained buoyant, with primary issuance for the first five months of 2026 to the end of May up 29% to $186 billion, another sign of the Australian credit market’s maturity given previous periods of similar volatility usually resulted in diminished market activity.
The Australian primary credit market has grown significantly since 2021 with issuance up 3-4x (refer Chart 2). The $A primary market is now on par with CAD and GBP behind only the $US and EUR markets. Much of this growth has emanated from renewed foreign investor interest, who routinely make up ~40-50% of new bond subscriptions, attracted to one of the few remaining AAA rated economies offering higher yields.
Chart 2. Investment Grade Senior and Sub Debt Issuance ($Abn equivalent)
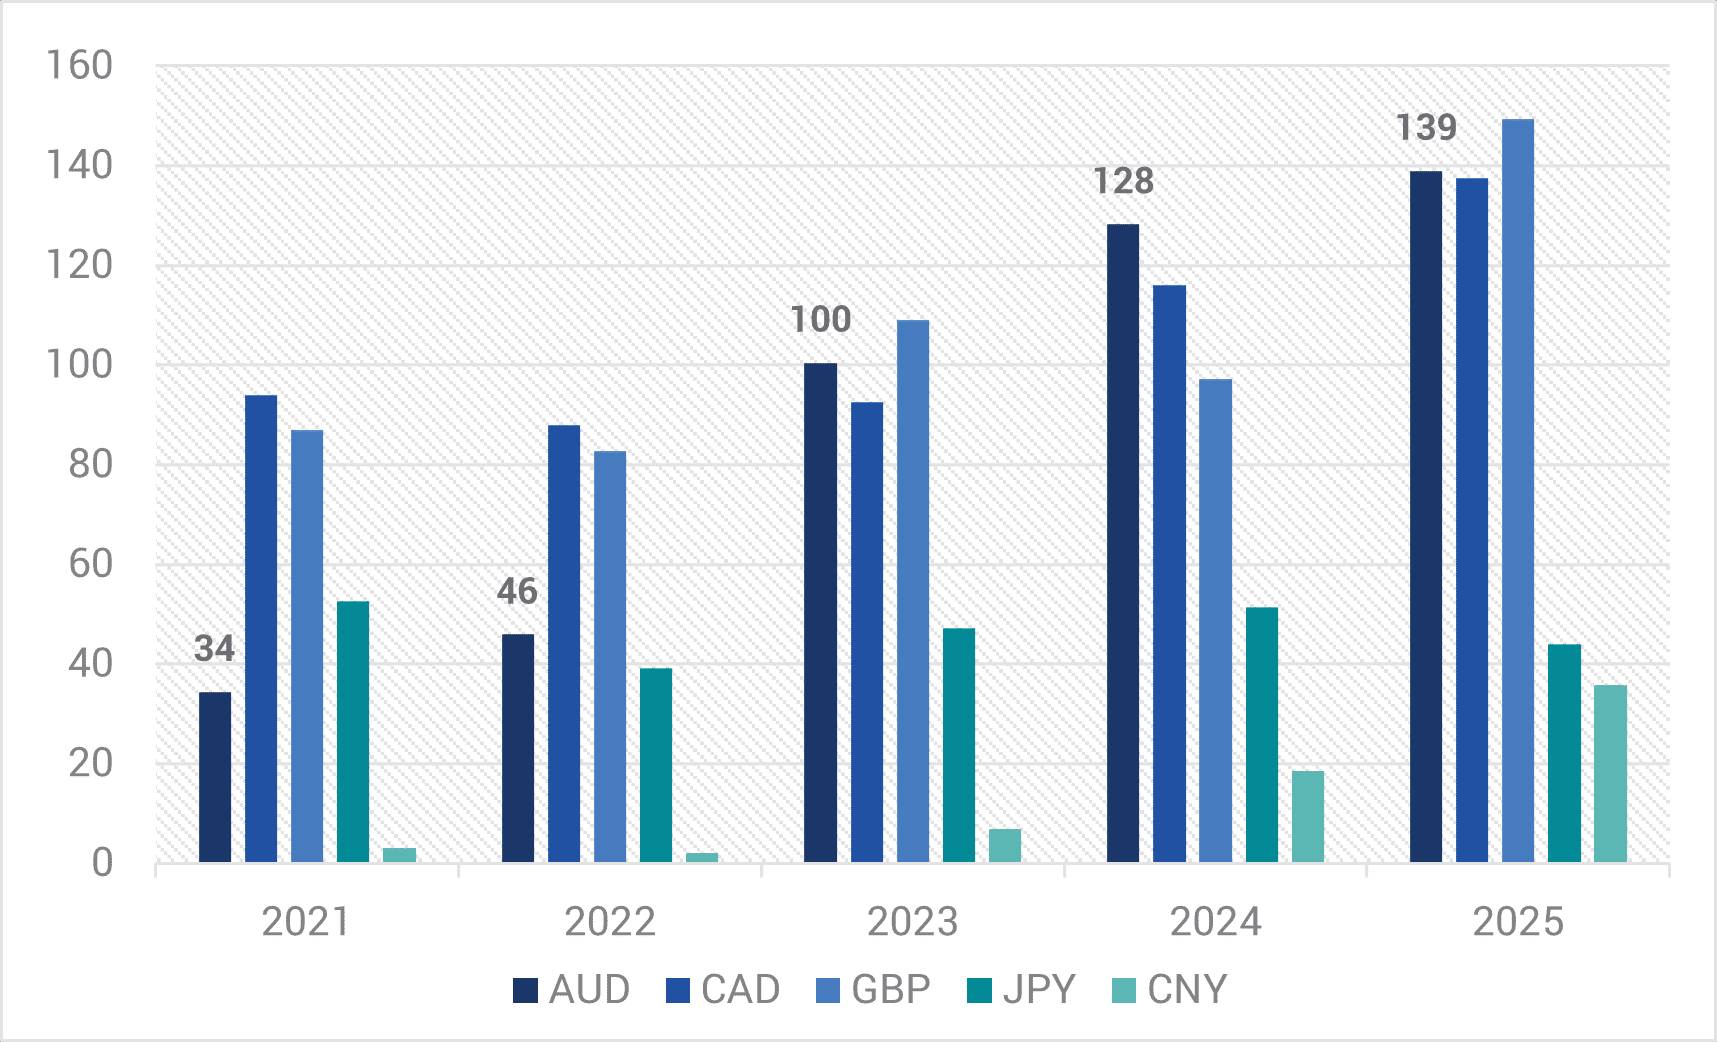
Source: Bloomberg & Deutsche Bank – 31 Dec 2025.
In relation to credit spreads, the combination of a supportive growth environment and higher government bond yields generally coincides with tighter spreads, especially for investment grade (IG) credit. Investors tend to focus on outright yield in their fixed income asset allocation decisions and with high quality IG yields currently above 6%, credit spreads are playing a more minor income generating role. Looking at Australia’s high quality major bank T2 and triple B corporate segments, the push-up in yields above 6% (higher than long-term averages) has coincided with credit spreads contracting below long-term averages (refer Charts 3 and 4). Important to note however, credit spreads remain well above pre-GFC tights, which was the last combined period of high outright yields and low credit spreads.
Chart 3. Major Bank Tier 2 5YR FRNs: Credit Spreads and Yields
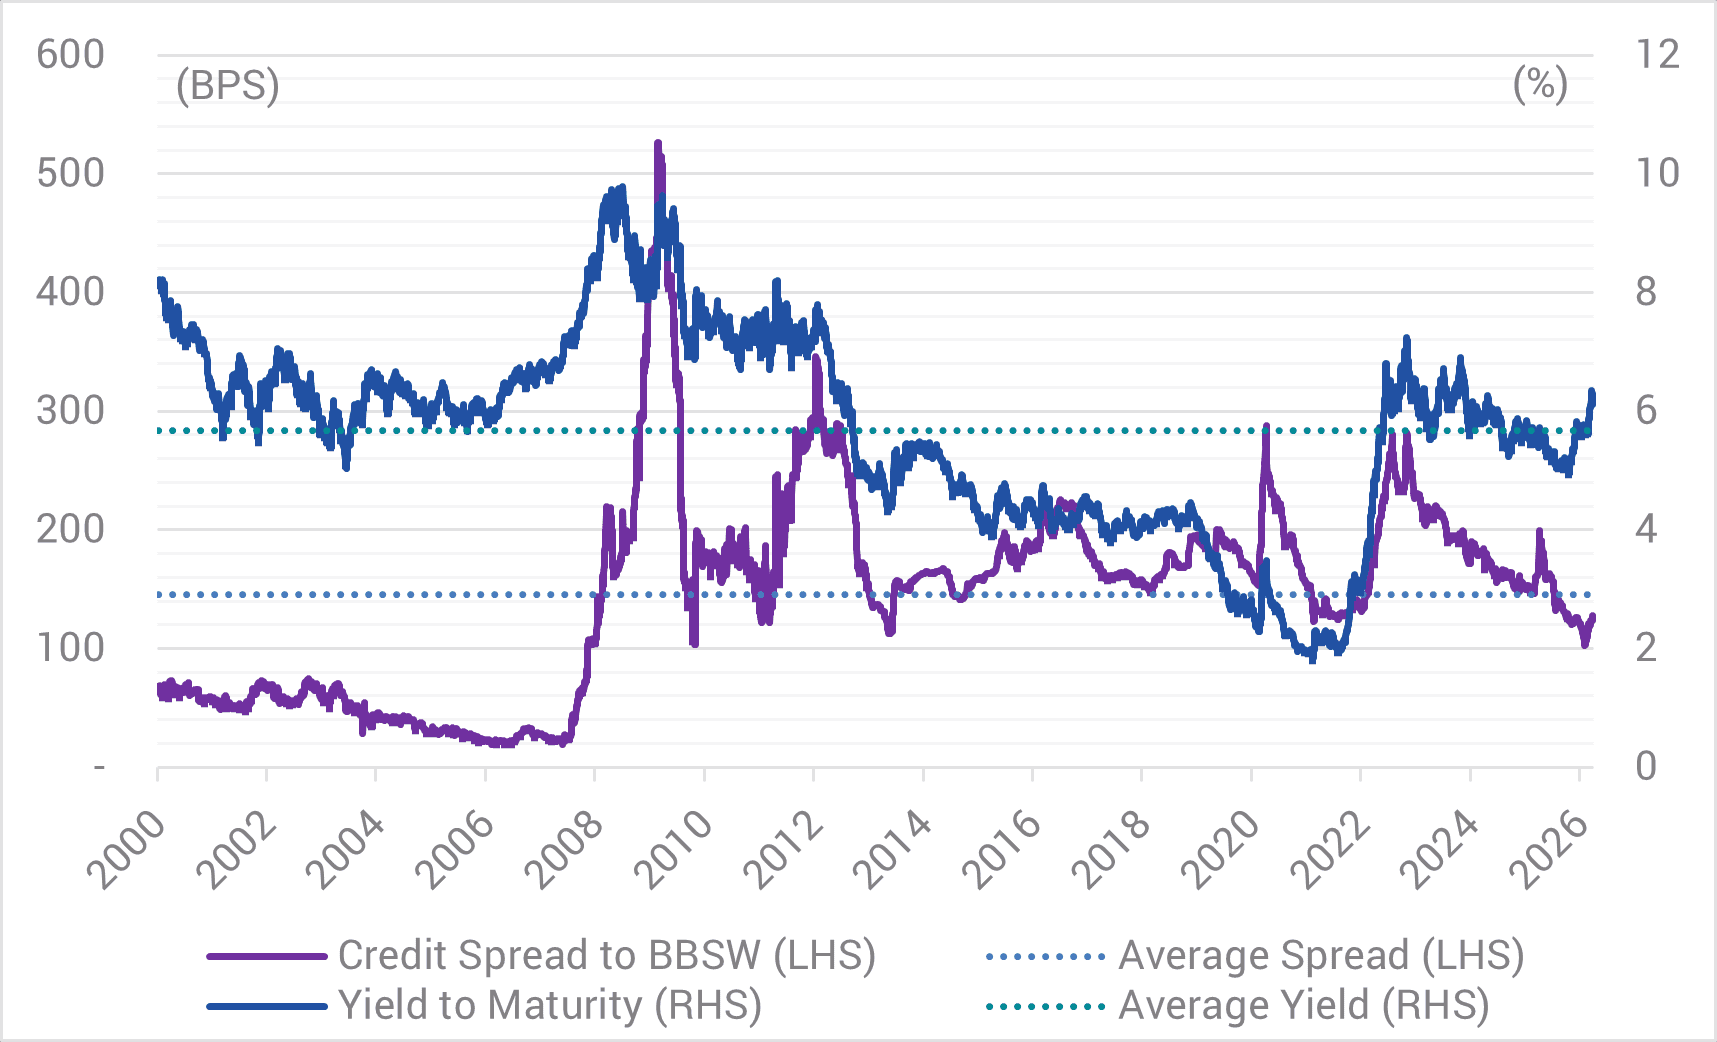
Source: YCM & NAB – 30 Apr 2026.
Chart 4. Triple B Corporates: Credit Spreads and Yields
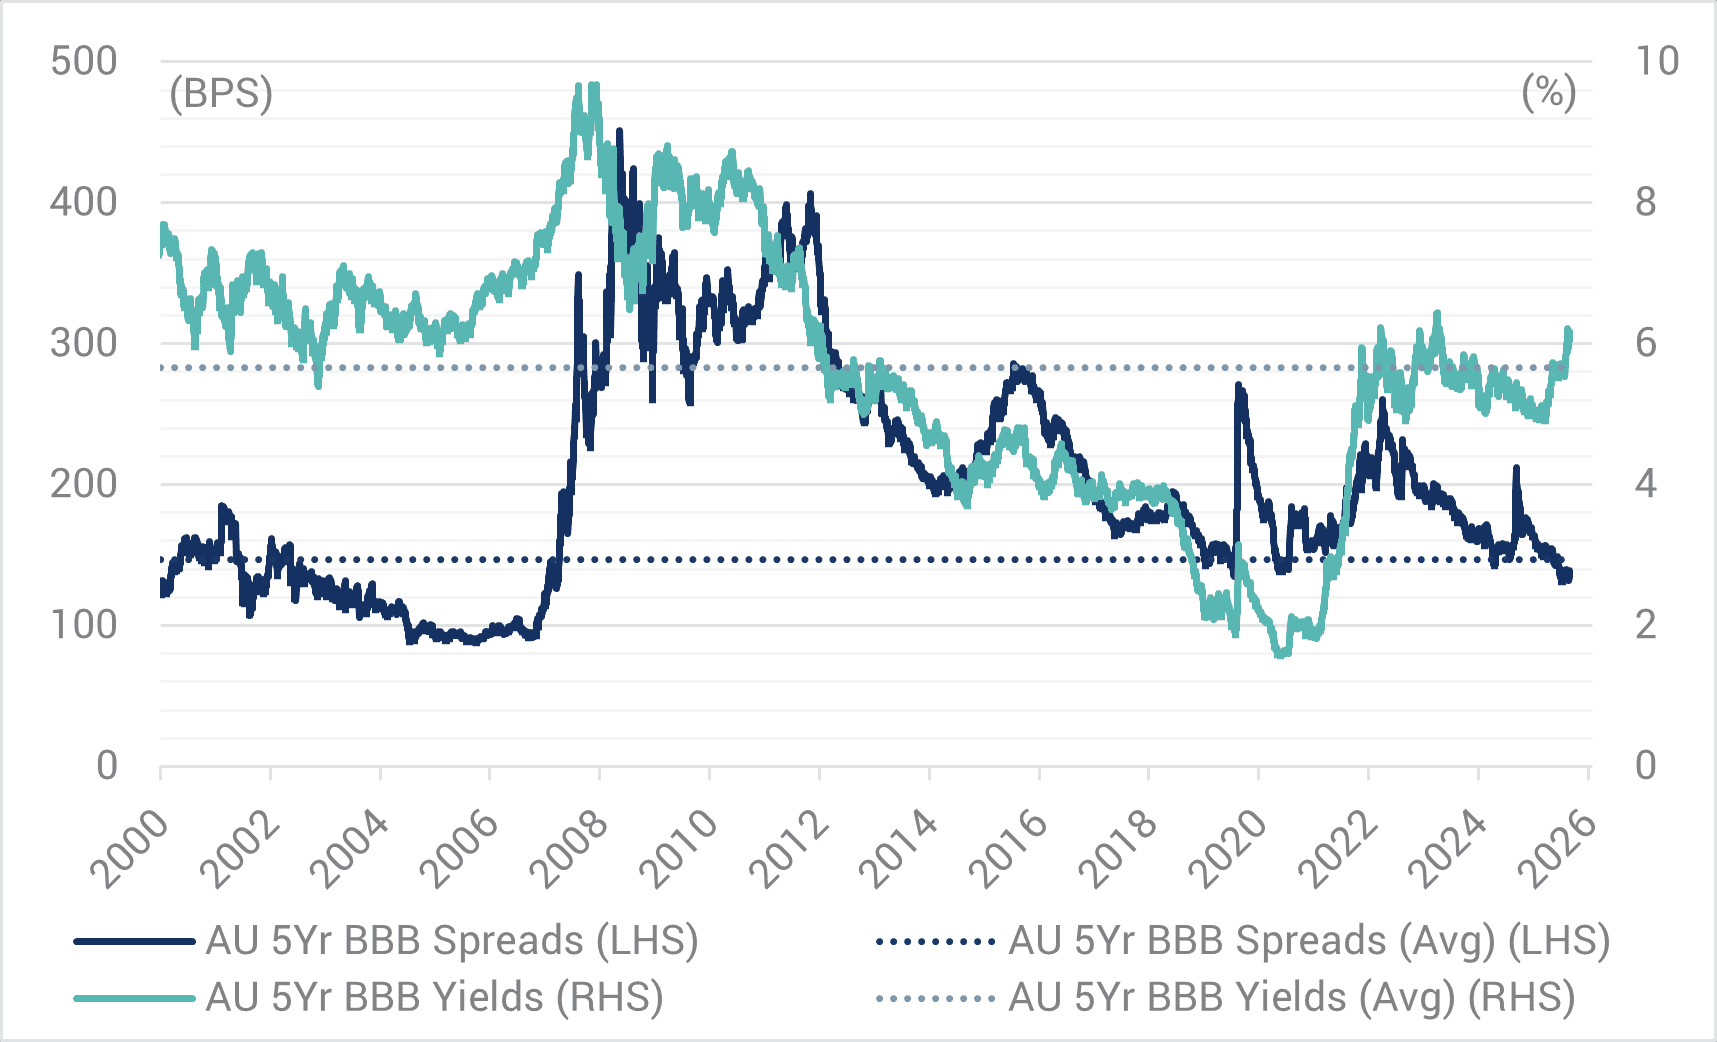
Source: YCM & NAB – 30 Apr 2026.
In return composition terms, Australian BBB corporate credit spreads make up a low 20% of outright yields currently, a level last seen in 2007 (refer Chart 5).
Chart 5. Australian BBB Yields – Return Composition
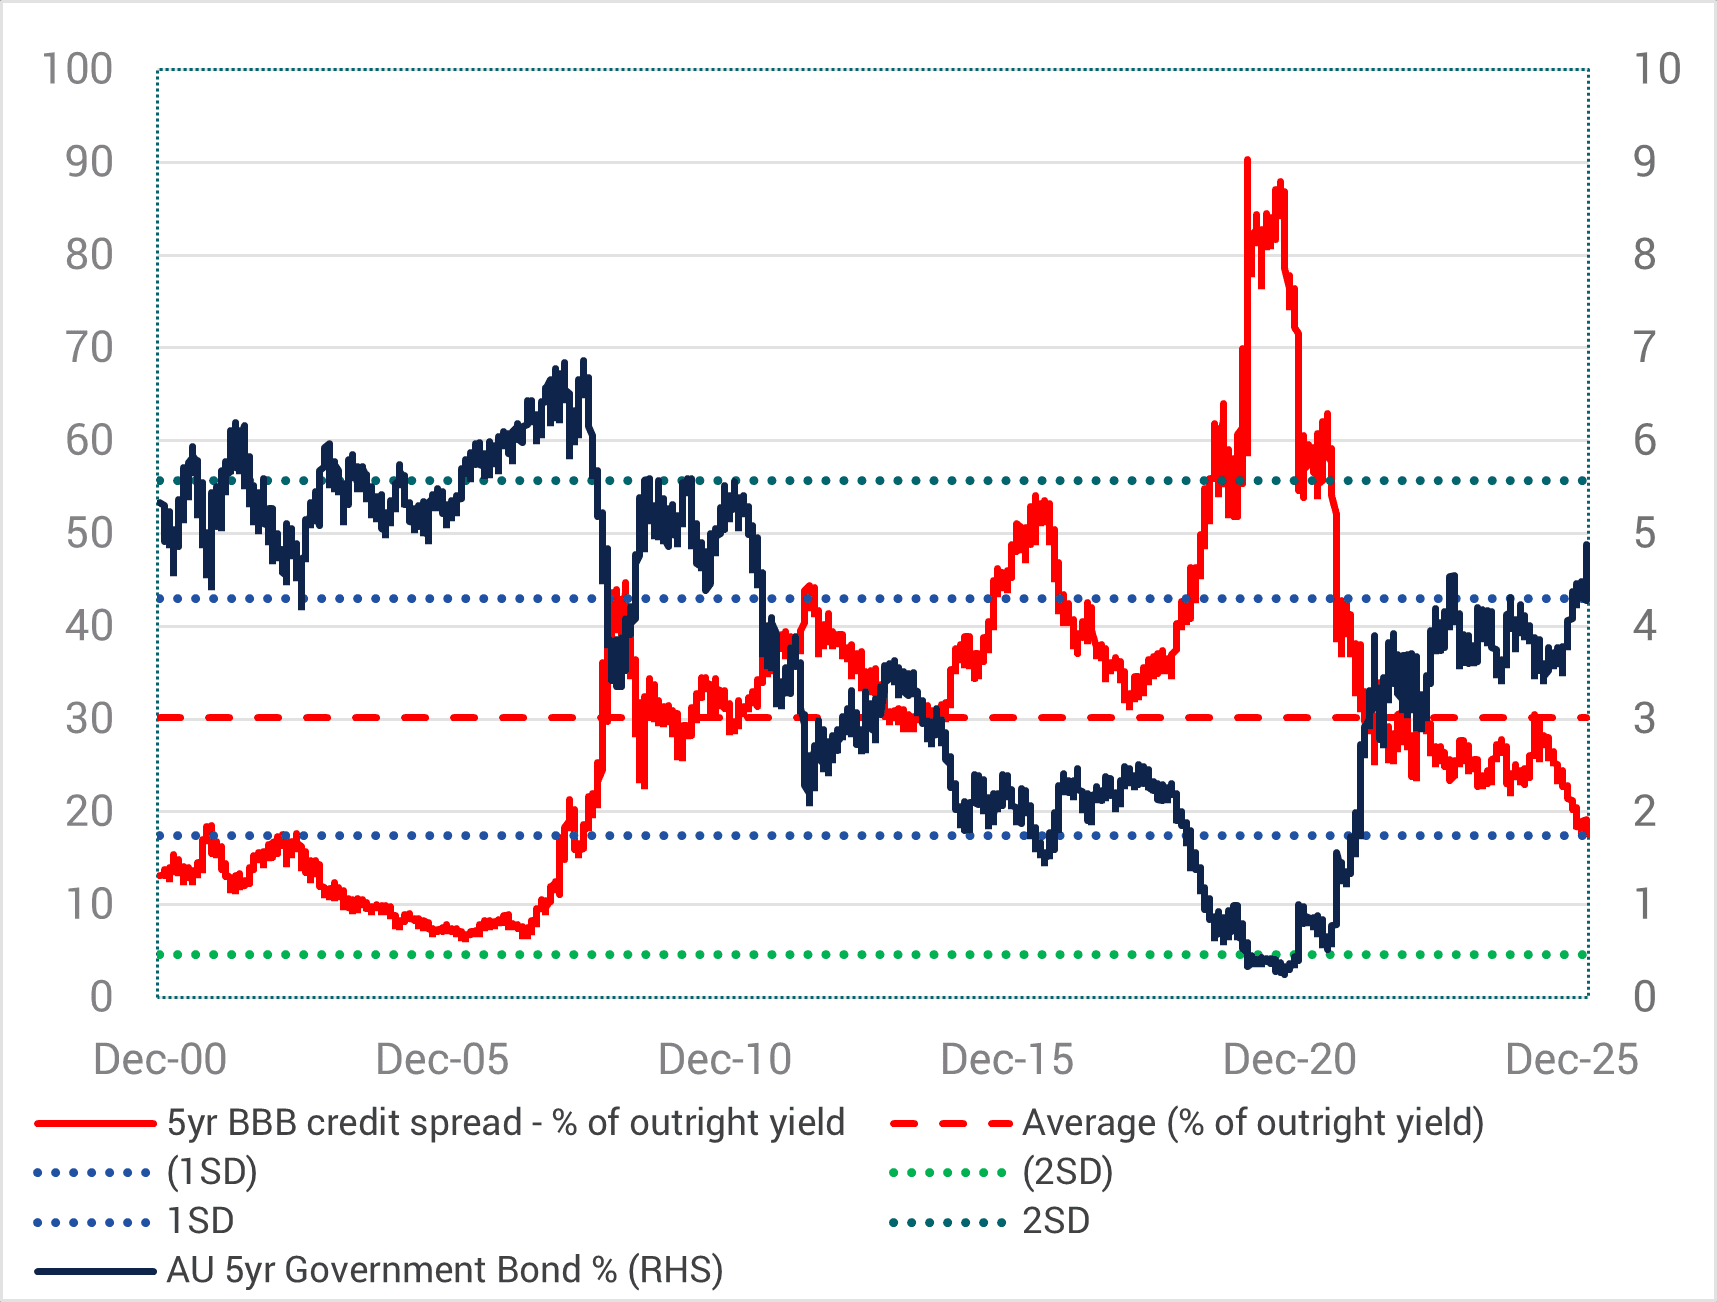
Source: YCM & NAB – 30 Apr 2026.
This combination of yield and spread is also consistent across our own credit funds (refer Chart 6) with the potential for this thematic to be prolonged.
Chart 6. EIF/HIF – Return Composition – Outright Yield and Credit Spread (%)
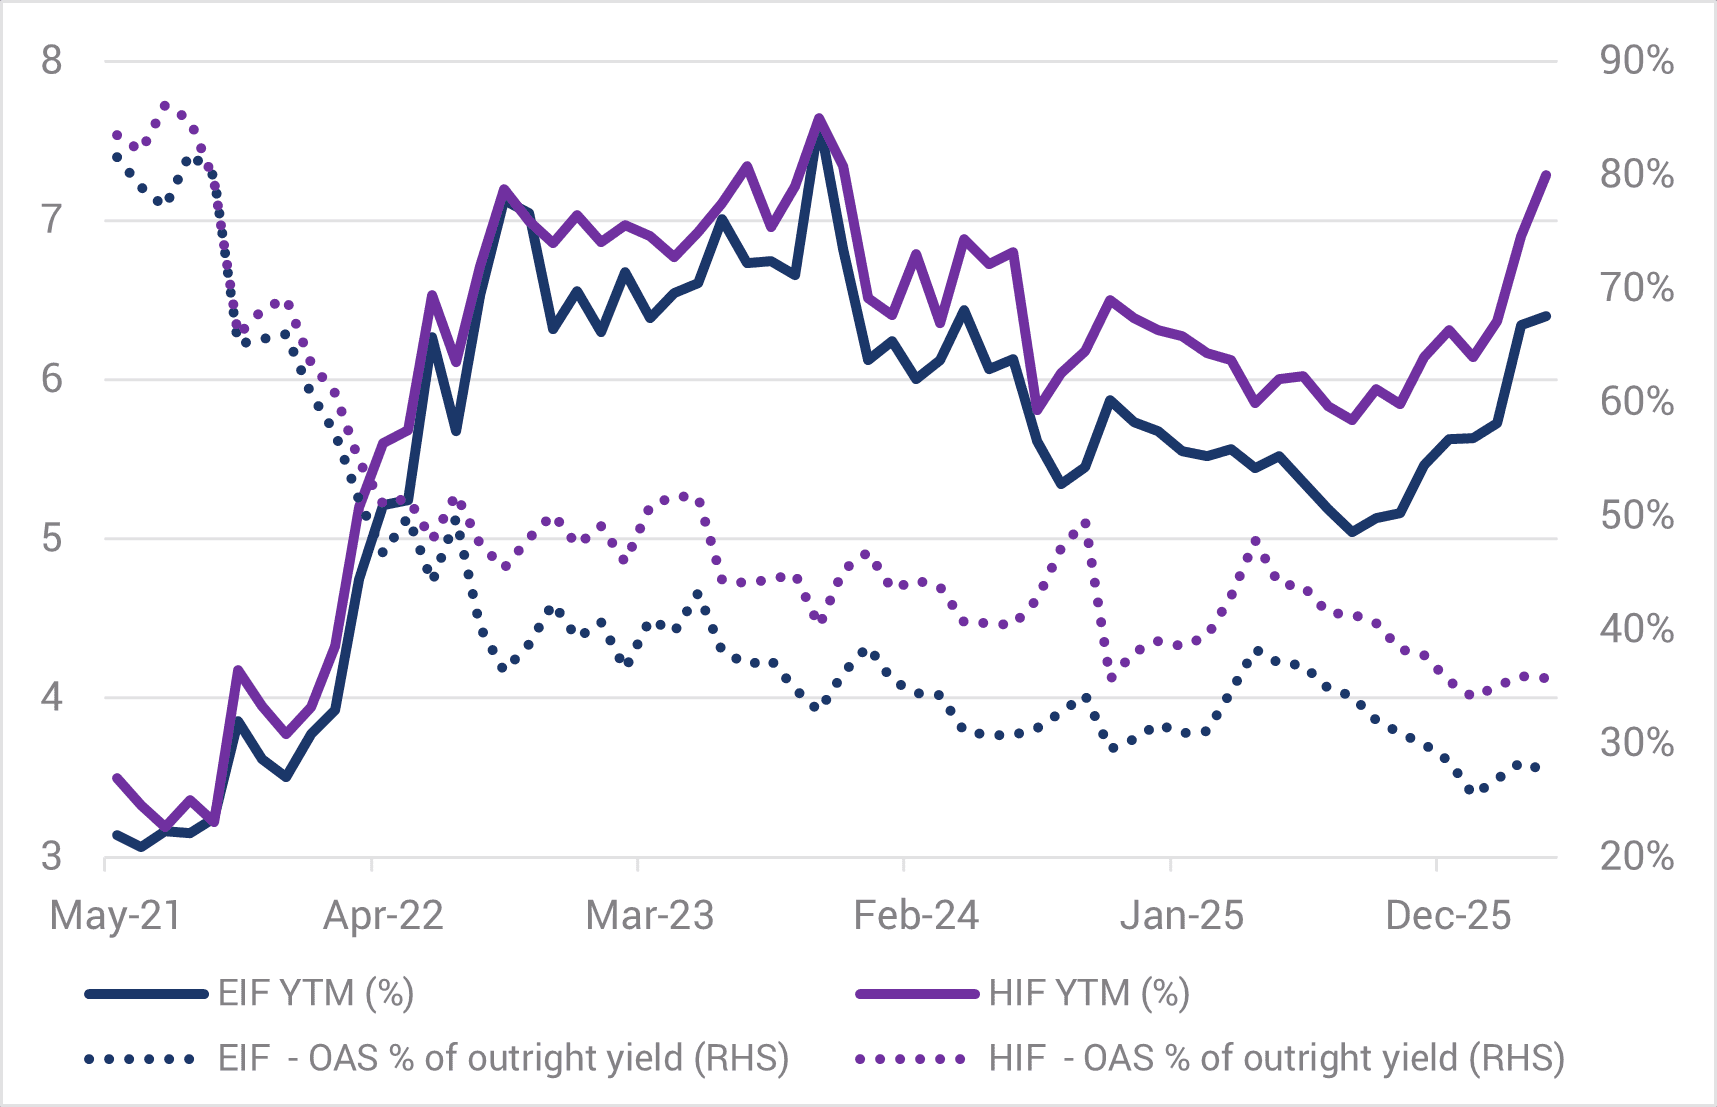
Source: YCM, 30 Apr 2026.
Actively managing to a prolonged period of lower credit spreads relative to higher outright yields has implications for funds managing to a return hurdle above a Cash/BBSW benchmark. In this instance, generating attractive, higher-than-average income for investors may also be associated with periods of underperformance due to underlying lower credit spreads. This brings an obvious conundrum, where what’s appealing to investors’ in maximising high IG portfolio income may result in intermittent periods of lower excess returns compared to return hurdles. For us, we are motivated to maximise income and performance through-the-cycle and preserve portfolio quality at all times .
As for its duration, while no two eras are directly comparable, there are both some similarities and key differences today with the pre-GFC period. In our opinion, the current artificial intelligence (AI) capital expenditure boom is the predominant driver for maintaining the necessary supportive pro-growth backdrop despite the obvious headwinds from inflation, higher interest rates and oil prices.
While the 2002-07 period was blessed with numerous structural and cyclical tailwinds such as more favourable demographics and geopolitics, the rise of China, lower government/household debt levels and progressively lower interest rates, the same cannot be said about the current environment. Economies are generally more indebted and compelled to invest more in non-productive sectors to meet the needs of ageing populations and rising geopolitical risks, which is adding to inflationary pressures and higher interest rates.
Following a weakening in economic conditions, we suspect this return composition is likely to recalibrate in the second half of 2026, with government bond yields declining and credit spreads rebasing wider to maintain outright yields at attractive levels. This is similar to what occurred during April 2025 where that brief risk-off period was characterised by lower government bond yields, wider credit spreads and almost constant outright IG yields. Therefore, we believe it’s currently prudent to maintain some interest rate duration in portfolios, with the usual negative correlation between government bonds and credit spreads to be re-established in a meaningful risk-off and once again offer drawdown protection in weaker economic times. Further, with interest rate markets continuing to price in further increases in interest rates, the downside from owning some duration protection seems relatively limited.
Currently, attractive income of 6-7% for IG portfolios combined with the use of modest interest rate duration when required, supports the generation of attractive positive returns in most theoretical scenarios over a 12-month period (refer Table 1).
Table 1. Australian BBB Yields – Return Composition
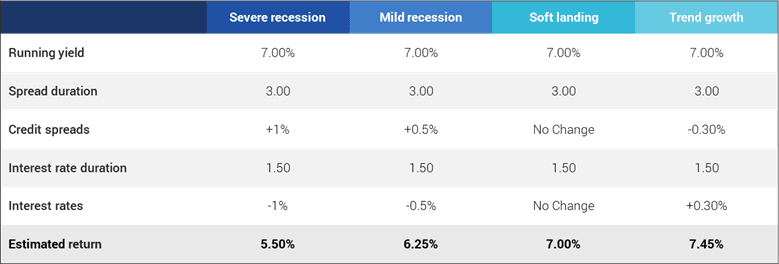
Source: YCM – 31 May 2026.
While these scenarios may vary and the correlations between government bonds and credit spreads can be disrupted for a period, the road to positive returns in most scenarios is paved by the almost non-existent IG defaults compared to high yield. Historically, this has meant minimal permanent loss of capital across different economic circumstances. As with the US data presented in Chart 7, Australian IG defaults are also virtually non-existent.
Chart 7. US IG and HY Default Rates (%)
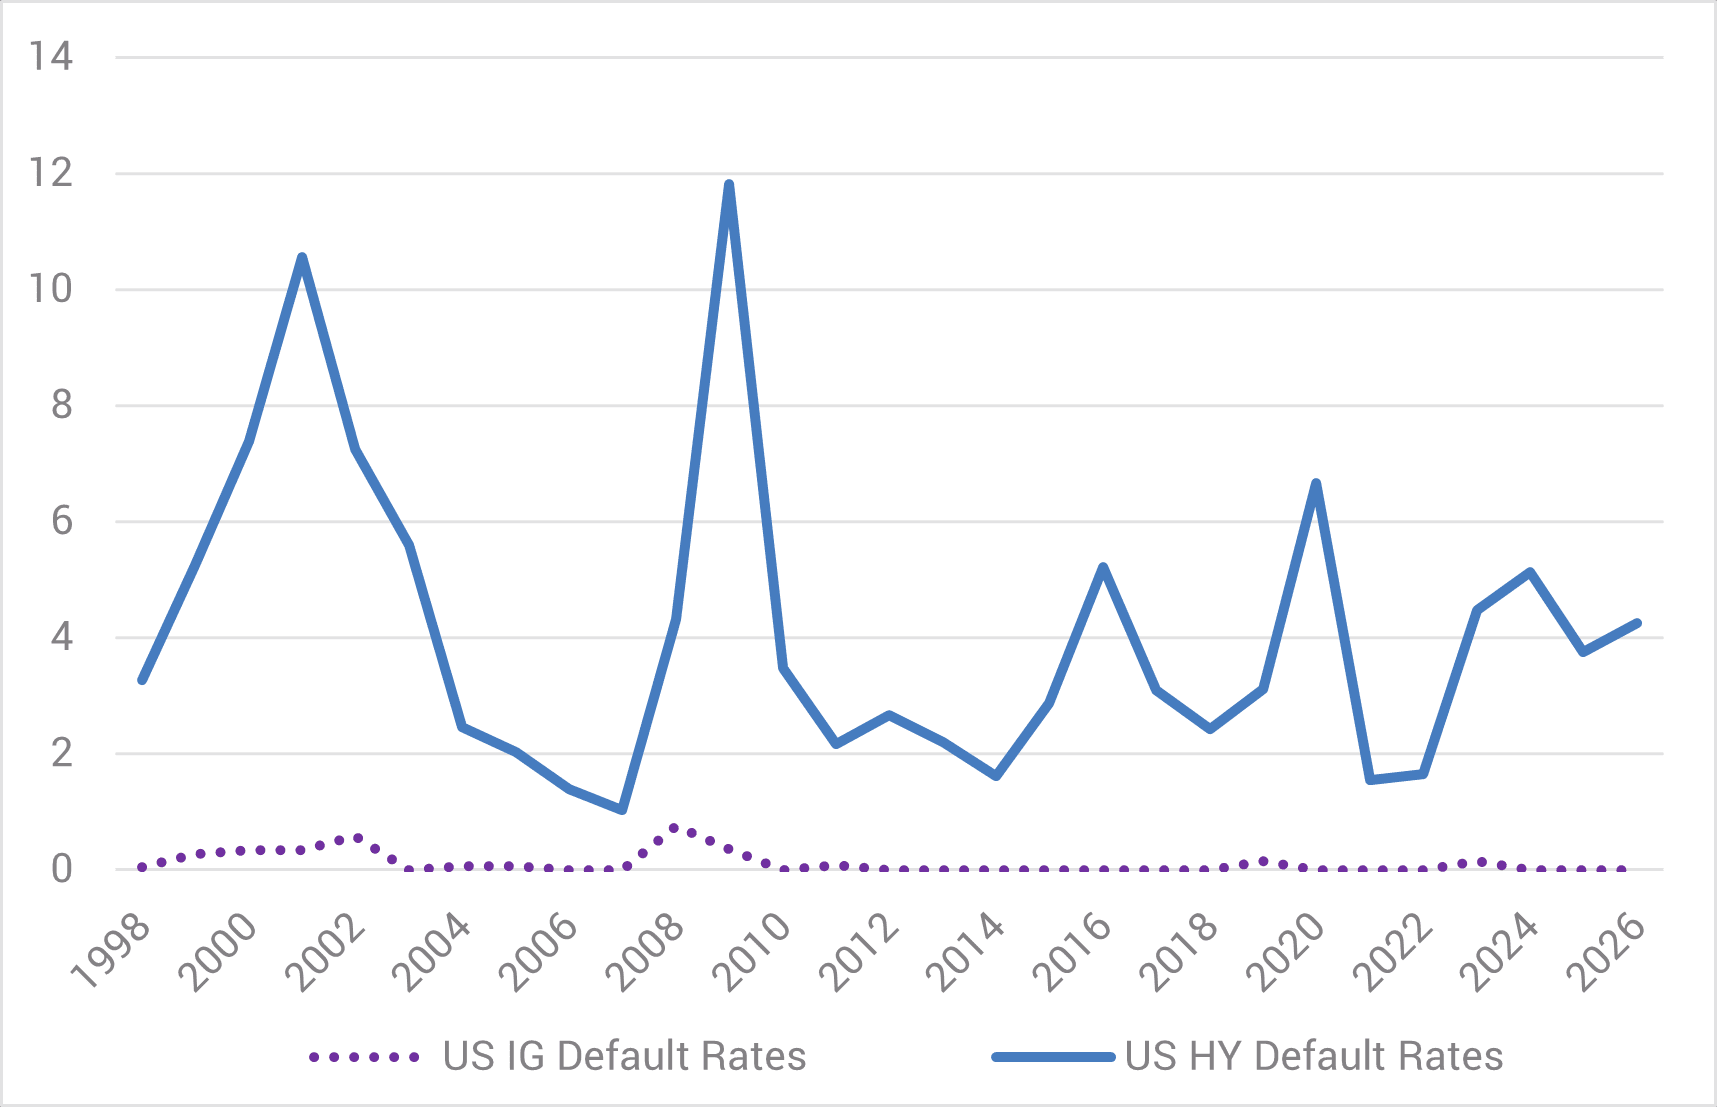
Source: YarraCM/S&P Global, 14 Jan 2026.
Despite the ongoing volatility, higher yields reign supreme today in providing investors with both attractive and defensive income of ~7%. However, we remain cognisant of underlying risks and managing portfolios accordingly to provide drawdown protection while continuing to maximise through-the-cycle returns.


0 Comments