Tim Toohey, Head of Macro and Strategy at Yarra Capital Management, provides his responses to the top 5 questions he’s getting from clients during the COVID-19 pandemic.
1. How ‘wrong’ is consensus on economic growth?
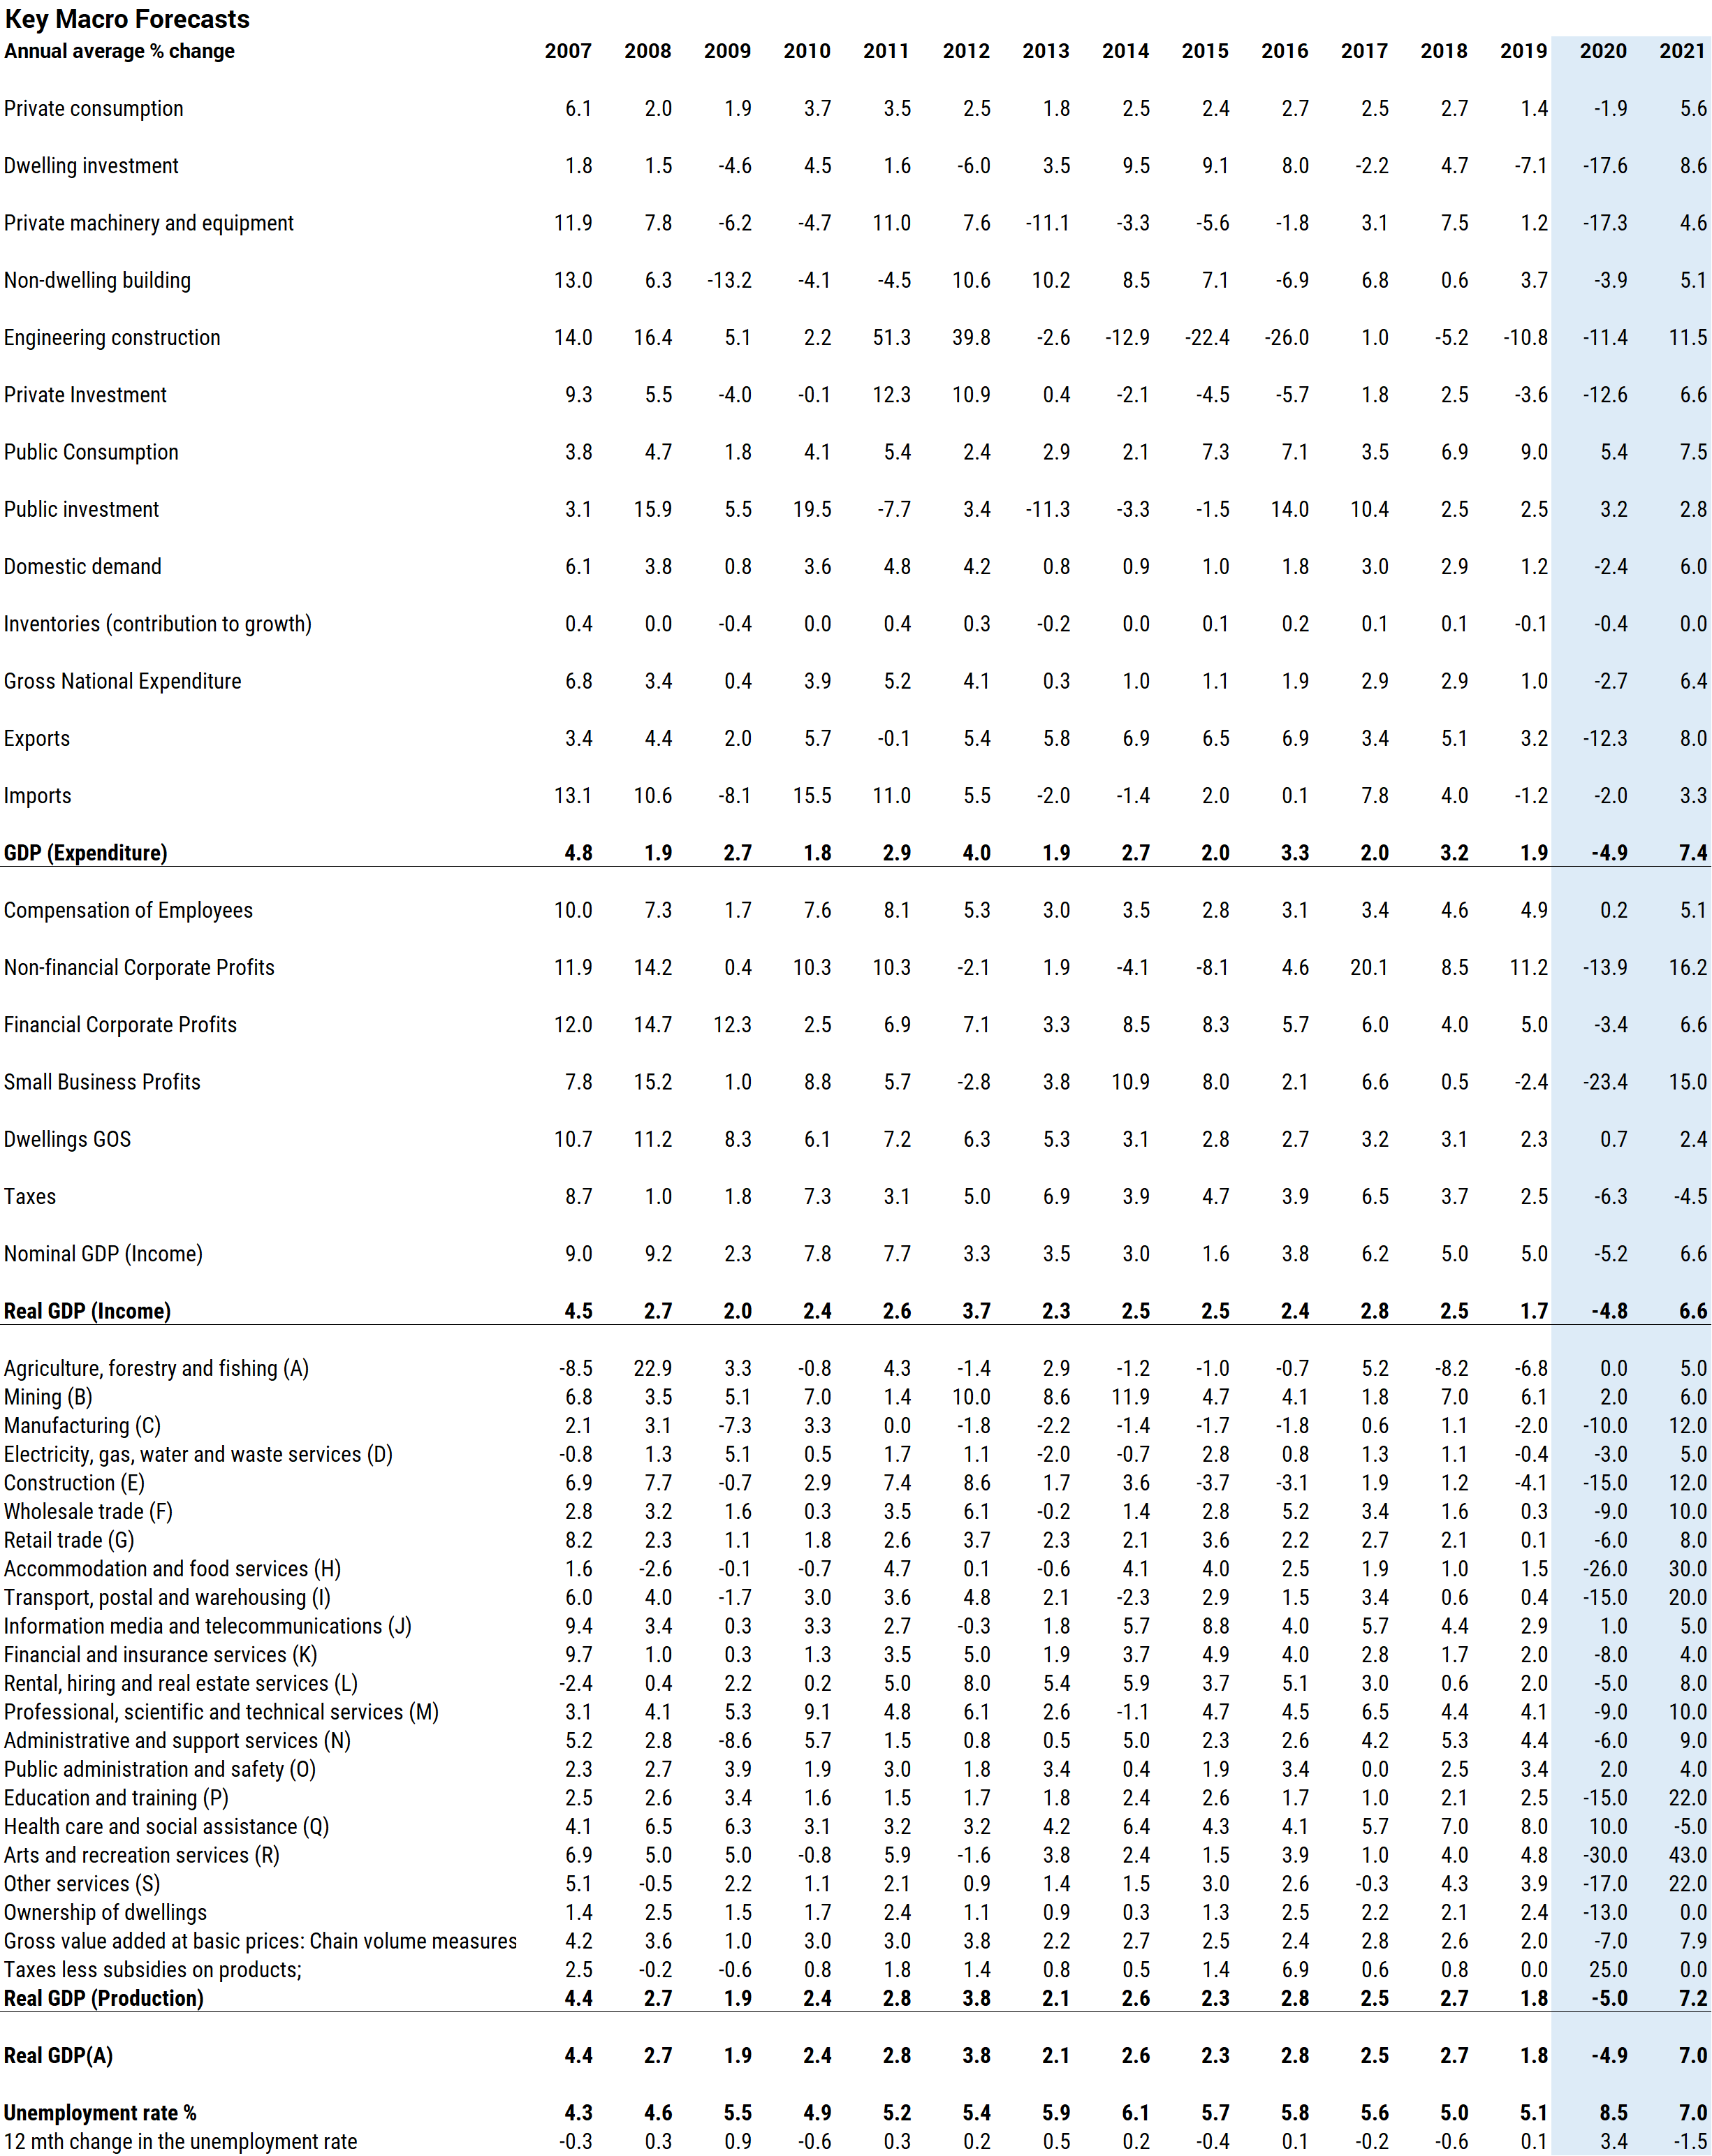
Traditional economic forecasting techniques and models are largely redundant in a world of Government directed self-isolation and selective shut downs of key industries. Appendix A provides the detail behind our economic forecasts from an expenditure, income and production basis. While we know with certainty that these forecasts will invariably prove wrong, they are at least constructed in an internally consistent framework that links production stoppages through to spending and profits, and represent our current base case assessment.
We expect Australian economic growth will contract 5% in calendar 2020 and recover by 7% in 2021. If we are correct, 2020 will be the worst year for economic activity in the post-War period.
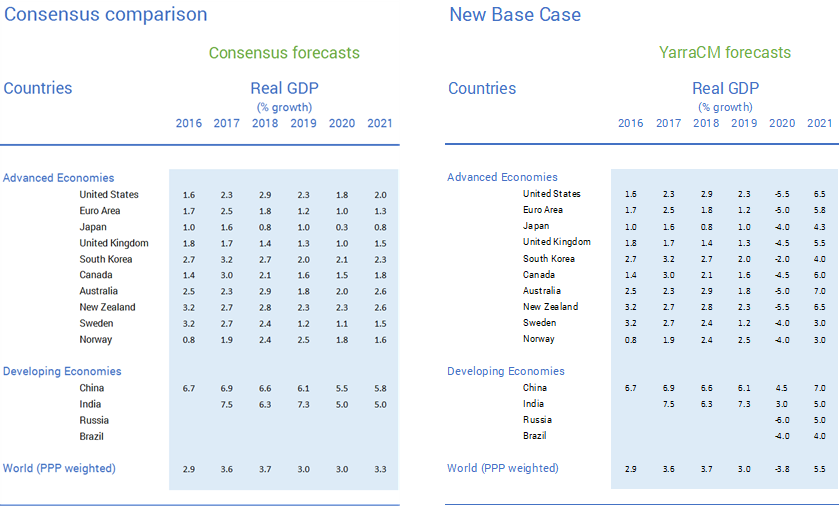
Consensus views for 2020 economic growth remain in flux. Bloomberg consensus forecasts fell by 130ppts in March, however, the consensus still expects economic growth of 0.8%. Although some members of the forecasting community have forecasts similar to Yarra’s we view the economic consensus numbers as slowly evolving. In short the consensus remains quite ‘wrong’ at the moment relative to the size of the economic shock.
Unfortunately, when we cast our eyes abroad we see a similar phenomenon. Contractions of -4% to -5.5% for most developed economies and ‘growth’ recessions for China and India are likely, yet these type of forecasts are proving slow to be reflected by the economics community.
2. What type of recession will Australia face?
Economic pundits have an unusual fascination with letters of the alphabet to describe the economic outlook: a short deep contraction followed by a recovery (“V”), a deep contraction followed by stagnation before an eventual recovery (“U”), a deep contraction with stagnation the new steady state (“L”), an economy contracts for a multi-year period (“I”), and lastly a debt-deflation cycle (“O”).
Our forecasts place us in the “V” shaped recovery camp. A 7% recovery in economic growth in 2021 sounds exciting. However, WE call it a lower case ‘v’.
There will be still be $136bn in lost economic activity that otherwise would have occurred in 2020, and ~$55bn over the 2 years. Thousands of businesses will be lost and hundreds of thousands of lost jobs. Despite the 10.5% of GDP of emergency fiscal support announced so far, a cash rate cut to the effective lower bound, the deployment of a raft of QE programmes that were simply unthinkable just 8 weeks ago, reduced capital requirements for banks, loan ‘holidays’ for borrowers and a more competitive currency, we still see the unemployment rate approaching 10% by 3Q2020. Unfortunately, the revenue thresholds for participation make it unlikely that anything like $130bn will actually be distributed via the JobKeeper scheme in a six-month period.
Much of the growth recovery implicit in our forecasts comes from the cogs of the service sectors of the economy beginning to turn again upon the reversal of restrictions. The restriction period may change elements of the economy permanently and expedite trends that would likely have occurred over a longer time frame: online spending, remote-working, online education may all increase. It may also teach an entire generation the benefit of building in a level of emergency reserve of liquid assets into their saving plans.
However, there is no reason to believe that consumer preferences will alter dramatically post the lift in restrictions. People will still presumably want to eat in restaurants, meet in bars and clubs, attend sporting and cultural events and, in time, travel. Businesses will re-activate their workforce to meet those consumer wants and the wheels of commerce will spin again.
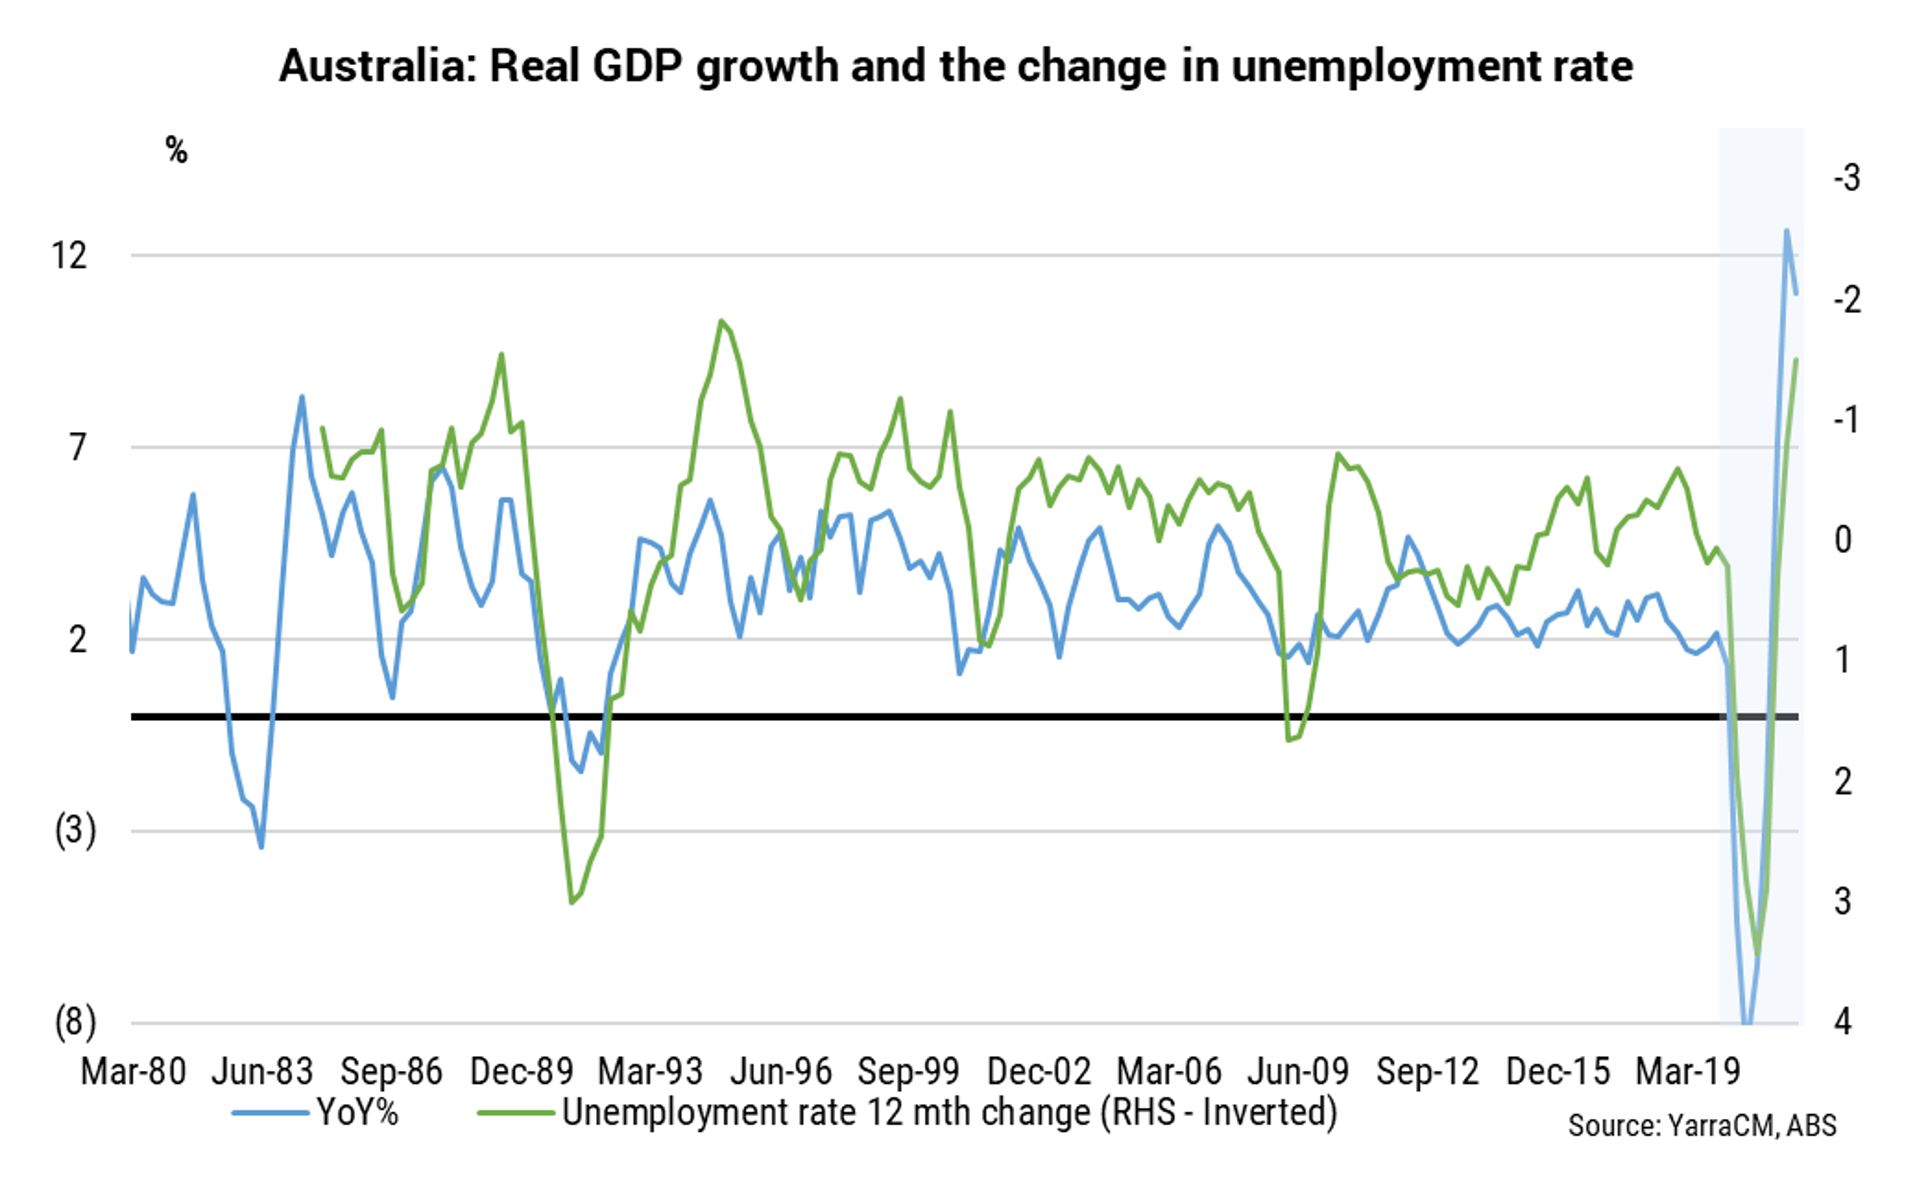
It is important to remember that this is not a recession that has been brought on by typical recession inducing factors (e.g. oil price spikes, asset bubbles bursting or economies running too hot only to be squashed by excessive monetary tightening). This is a deep recession we are ‘choosing’ to have in the interests of public health. The normal pushing on a string analogy to stoke an economic recovery at the bottom of the cycle for policy makers should not apply this time around. The pent up demand unleashed once restrictions are removed as people attempt to resume their normal lives makes a “V” shaped recovery the most likely recovery scenario.
3. Why not a “U”, “I” or “L” shaped recovery? What would change your view?
The longer the restrictions remain in place the greater the prospect of a “U” shaped recovery. In short, many businesses can survive a couple of months of lost revenue, few companies can survive a period of six or more months.
Moreover, it is not a linear transformation between economic loss and the restriction time. The interconnected nature of the economy means the economic damage is exponentially related to time. As such, the timeframe of the restrictions are paramount.
With the strong caveat that we are clearly not experts on the nature of this virus, the maths behind infection models are relatively straight forward. Our modelling suggests that if Australia’s rigorous social isolation and testing regime holds then peak infections will occur around mid-April and restrictions could be lifted around mid-June.
The key parameters of the modelling are the rate of infection, the interaction rate in the population, and the recovery rate from those who were infected. In the initial weeks of the virus the output from infection modelling is highly uncertain. The data inputs are largely unknown in the initial phase and vary from country to country. e.g. cooler climates have fared worse than warmer climates, mobility between population centres varies, and restrictions differ between (and within) countries. However, we are now at a phase of the virus where the inputs are somewhat clearer and scenarios can be derived with a greater degree of confidence.
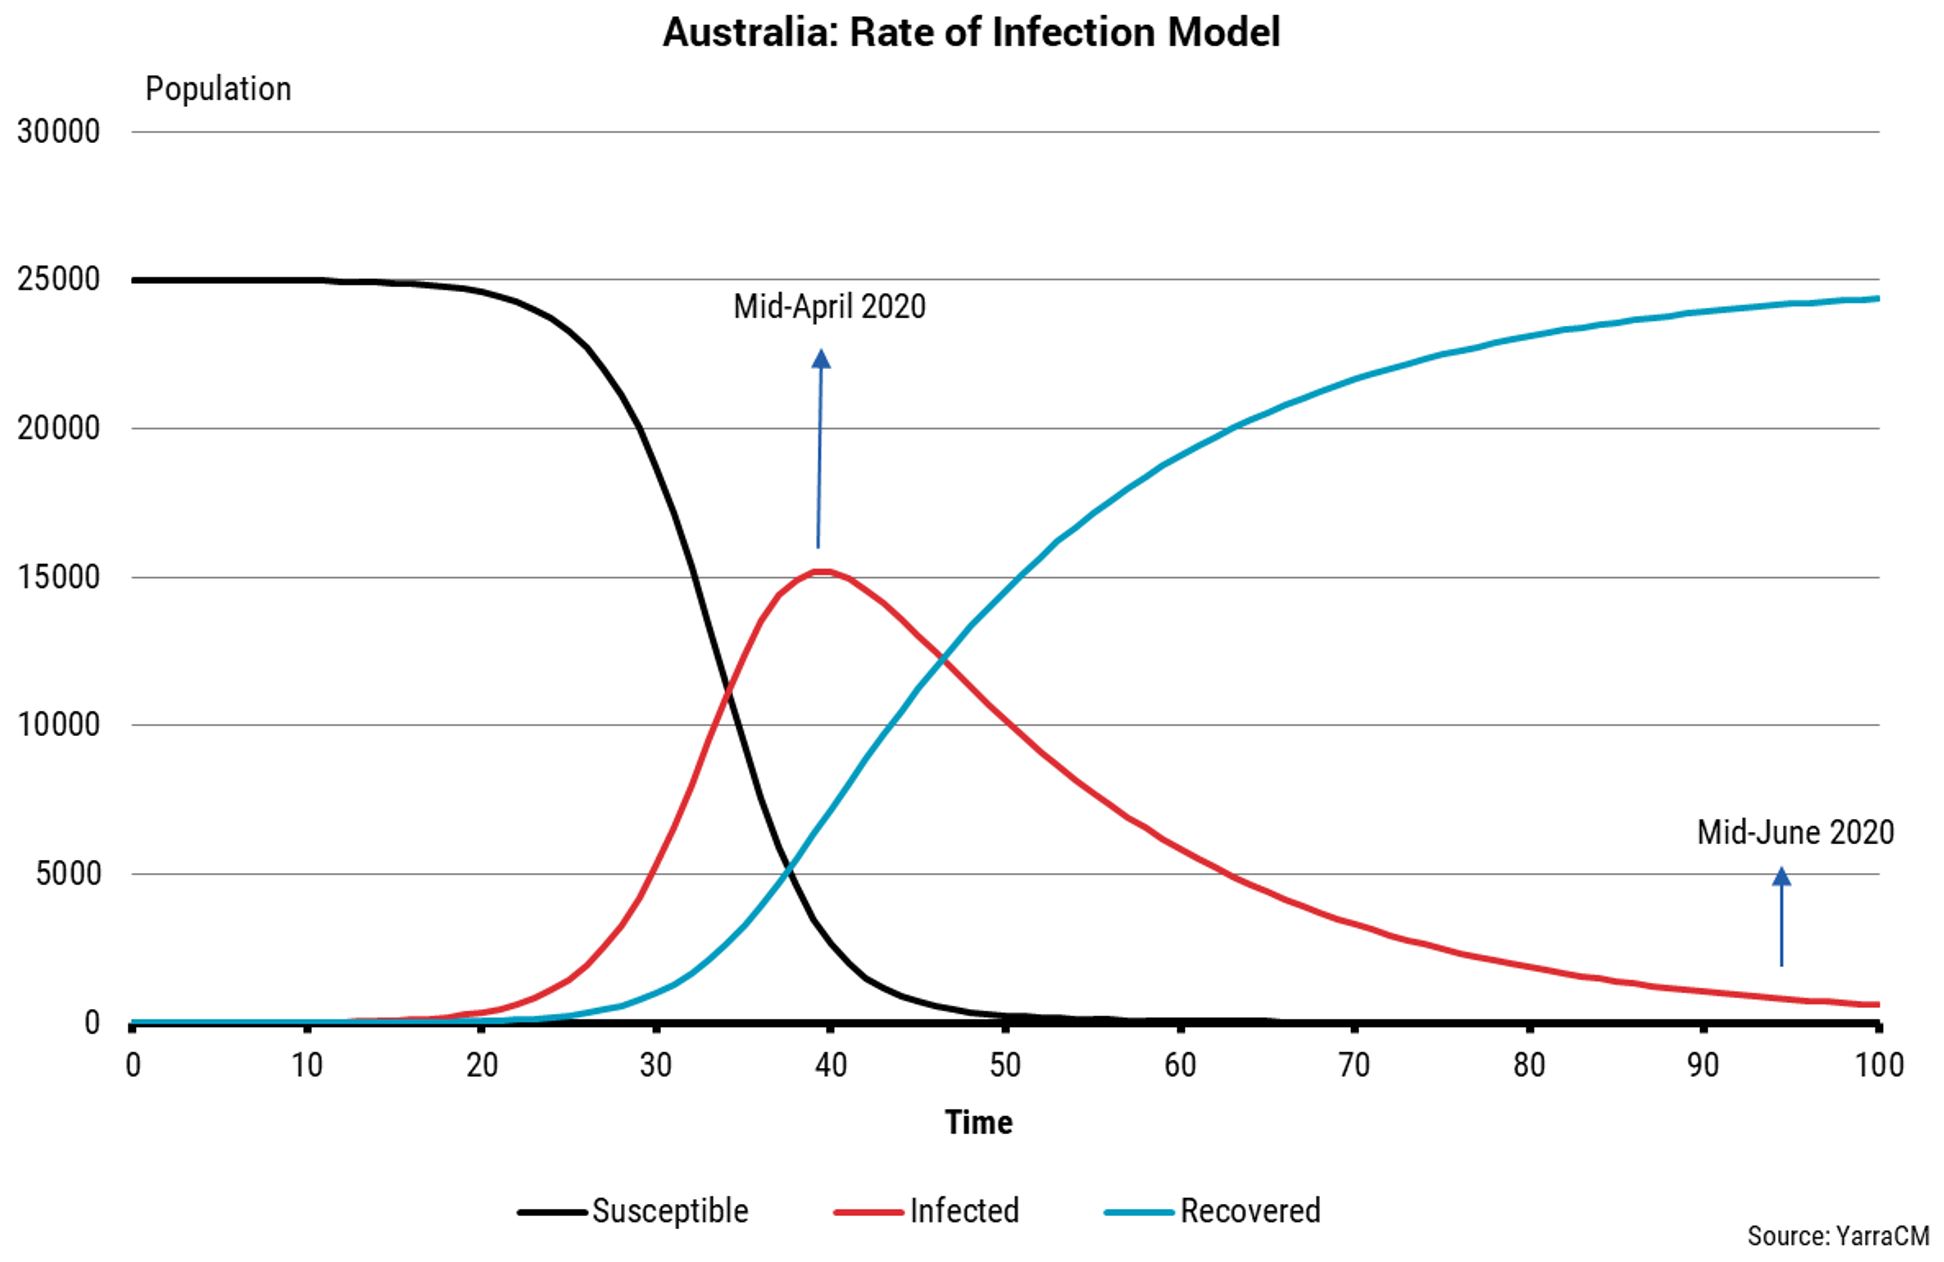
If our projections prove correct, at the very least it suggests that more economically harmful restrictions should be avoided. We are cognisant that Government’s ongoing reference to “assume six months of restrictions” would extend the restrictions to the end of August. Indeed, it is possible the current restrictions last that long, however, on the current trajectory that would appear excessive and at least some of the restrictions would have the capacity to be eased before then.
4. A debt-deleveraging cycle? Why not an “O”?
The most destructive scenario is that COVID-19 brings a sufficient economic downturn that unleashes the most pernicious and long-lasting forms of economic downturns – a debt deflation cycle similar in nature to the financial crisis. There are three main reasons why an “O” should be avoided.
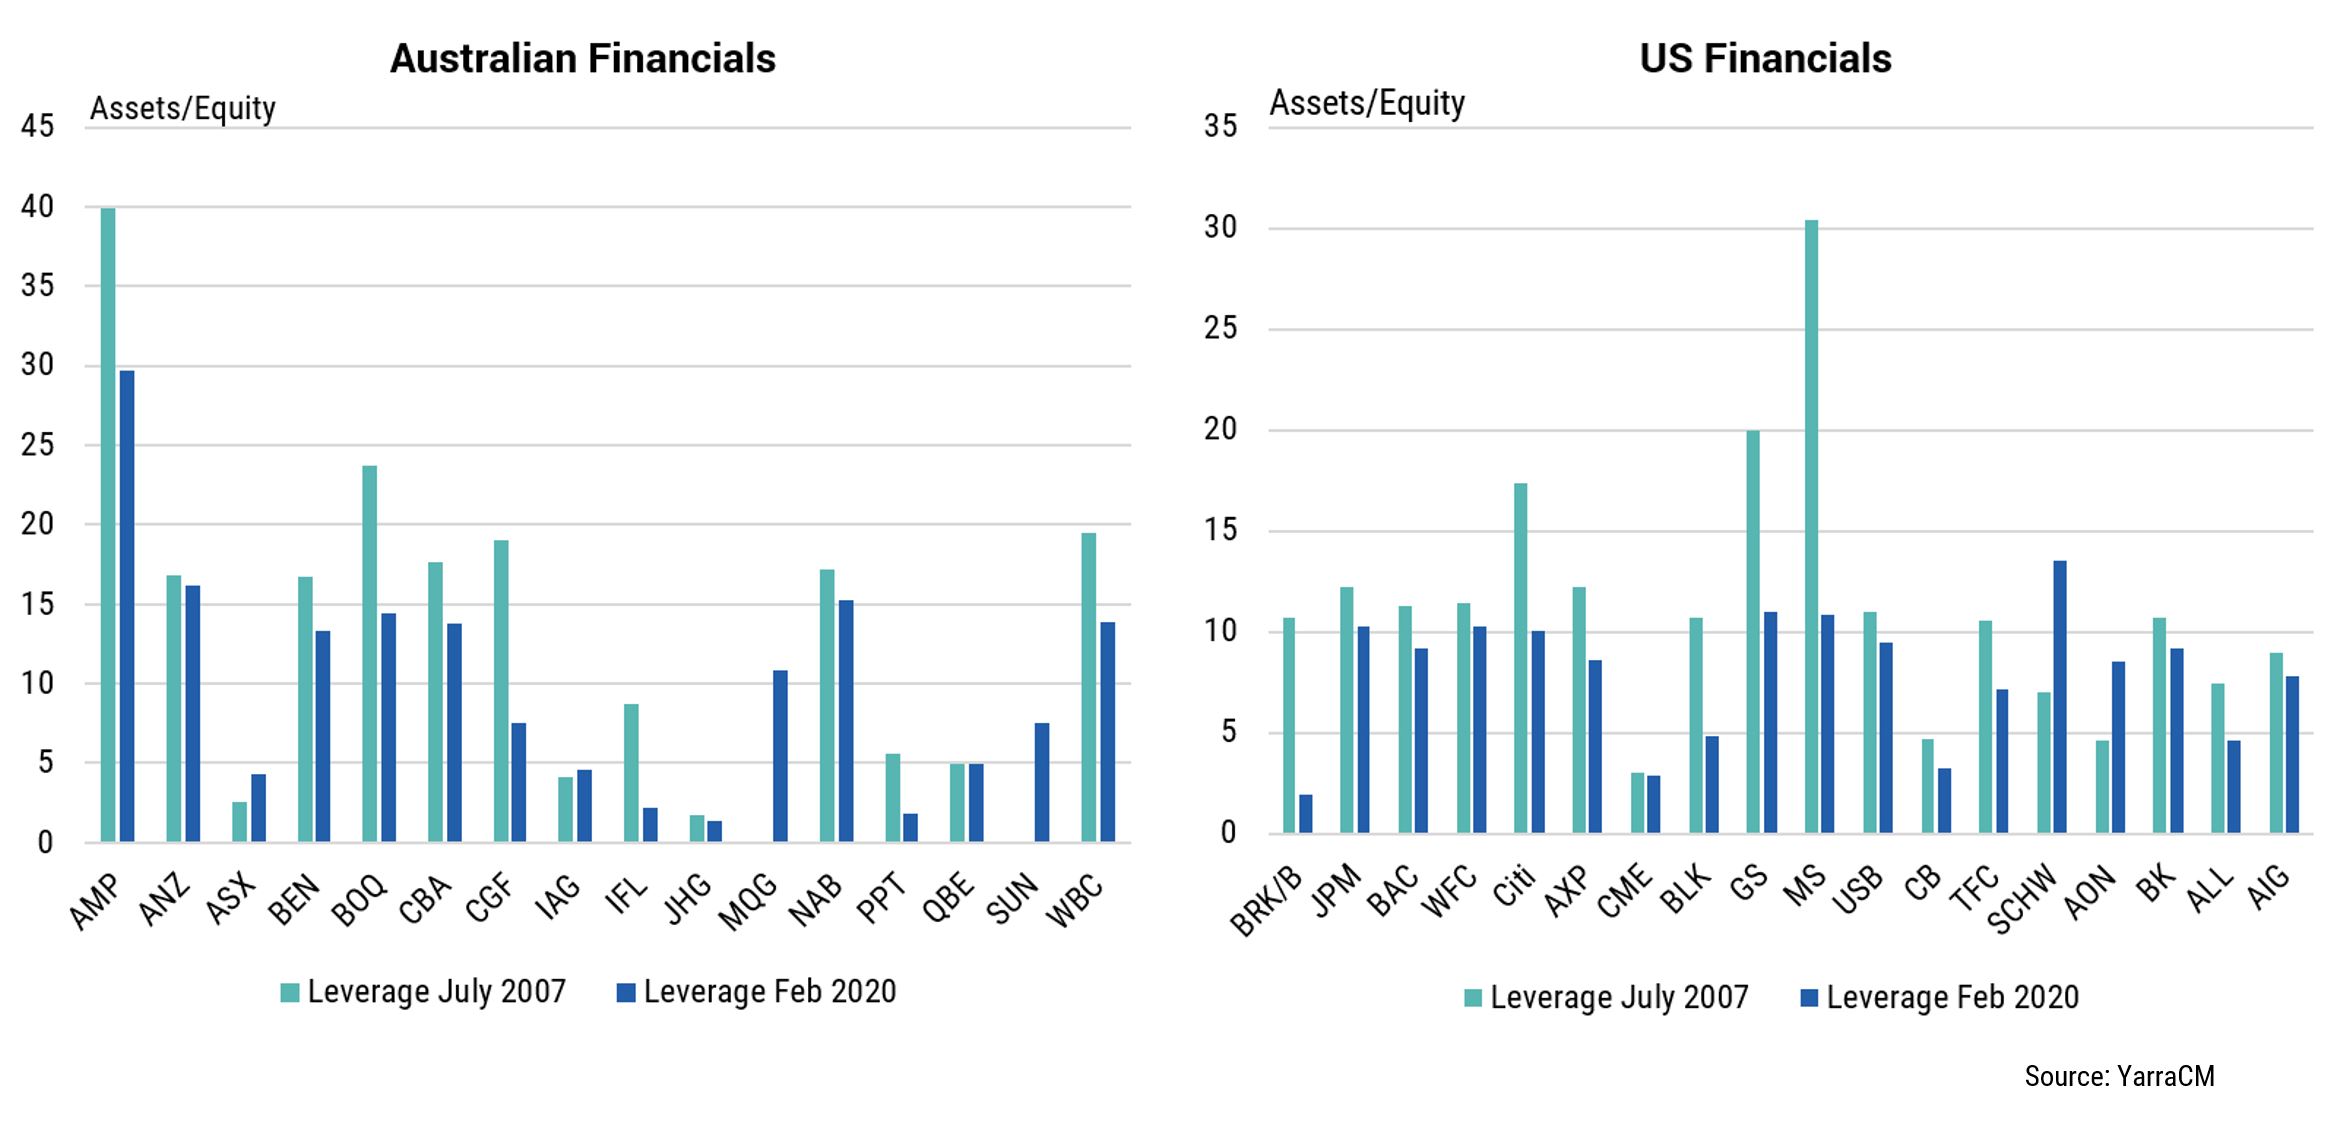
The first reason is that relative to prior to the financial crisis, leverage in the financial sector is much lower today. During the GFC one of the key factors behind the dysfunction in financial markets was the large degree of leverage by key financial firms and the use of derivative based products that complicated the knowledge of counter-party risk. Leveraged loans may still be the risk factor to watch, but in general there is less leverage in the systemically important financial institutions and less complicated structures on balance sheet.
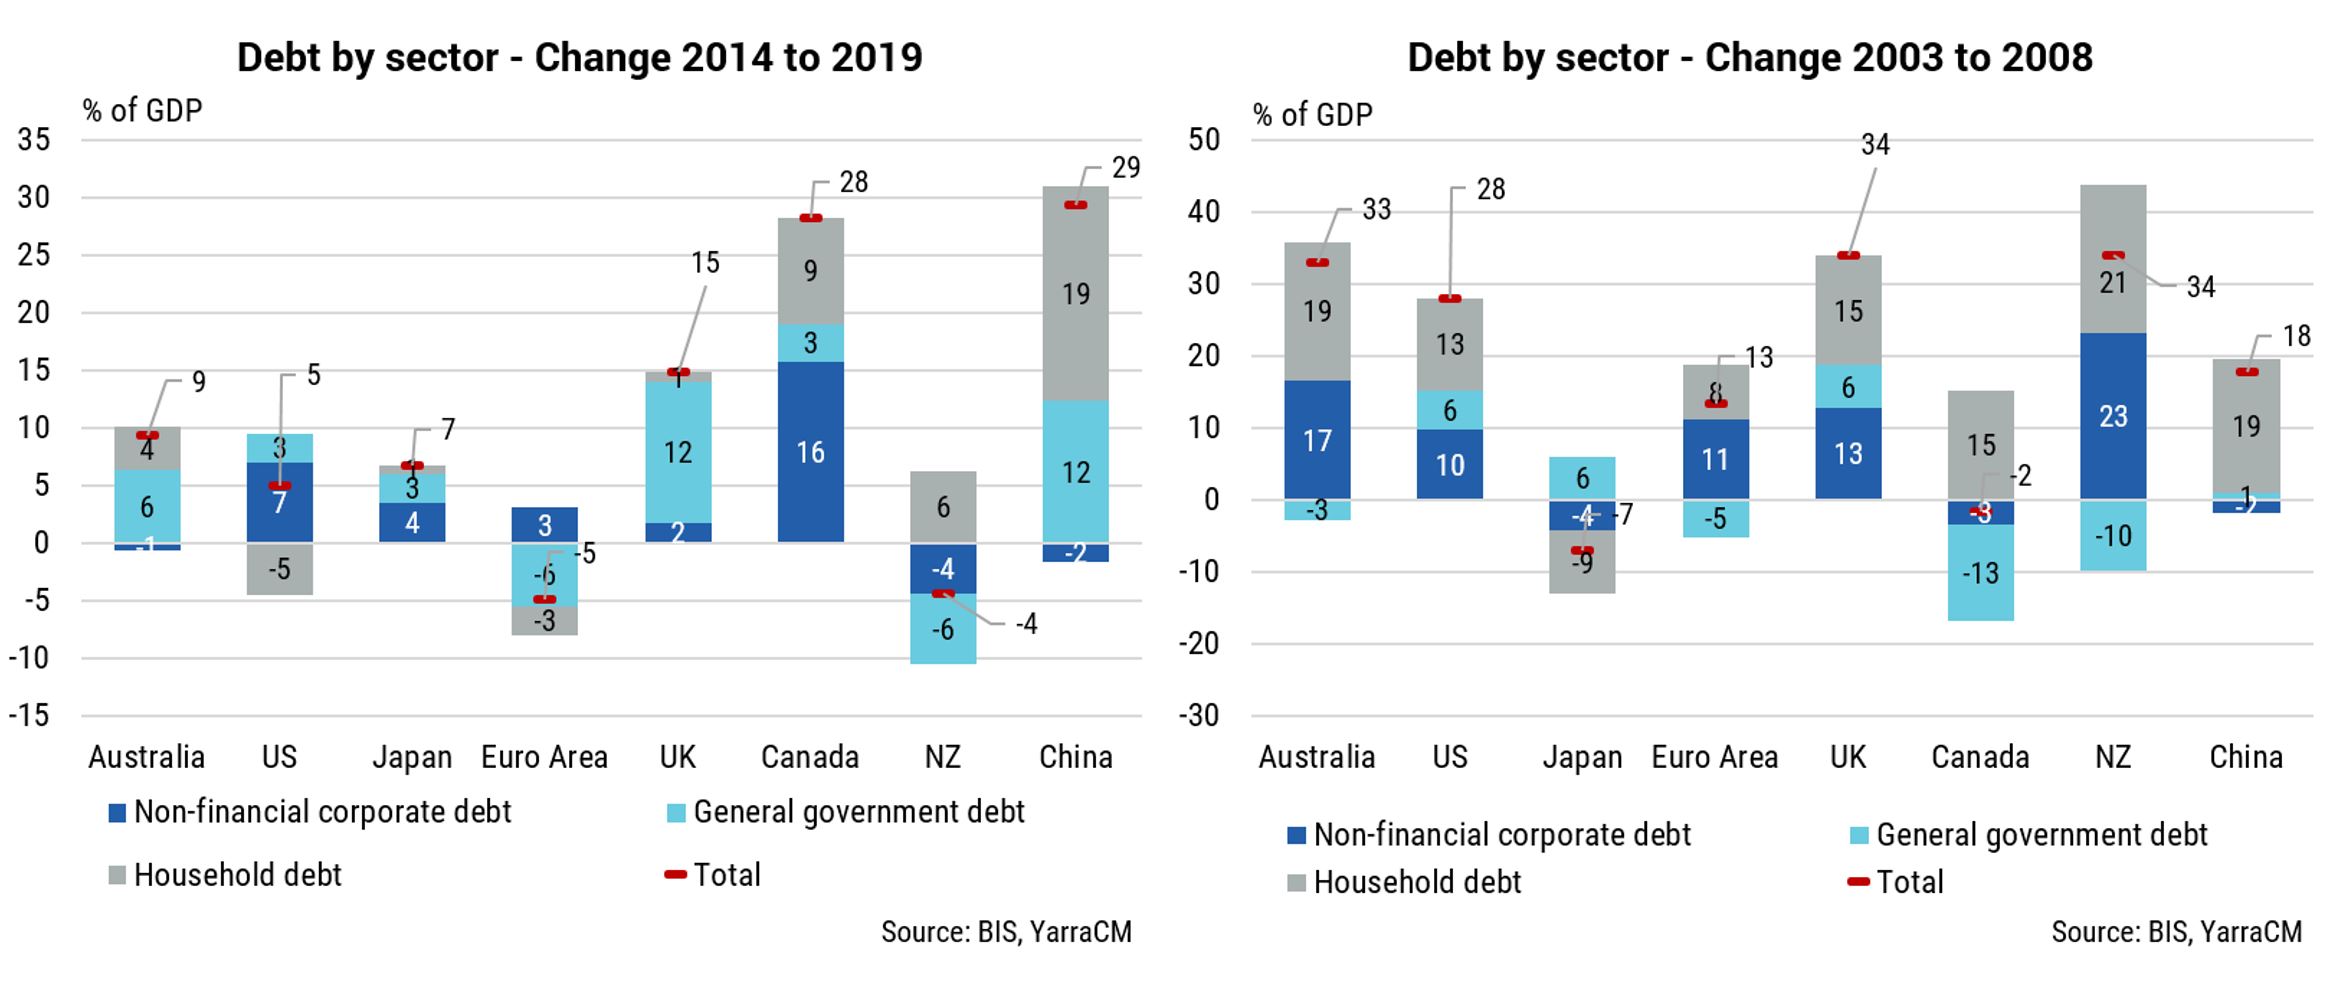
Secondly, although the levels of debt in most developed nations remains historically high, the main risk factor entering a crisis is the rate of accumulation of debt into the crisis point. The accumulation of debt in the five years leading into the crisis has been far lower relative to the five years leading into the financial crisis. In the US the accumulation of debt has been less than one-fifth of the 2003-08 experience and for Australia it’s been one-third. Europe has actually deleveraged over the five-year period to the end of 2019, whilst China is the main exception.
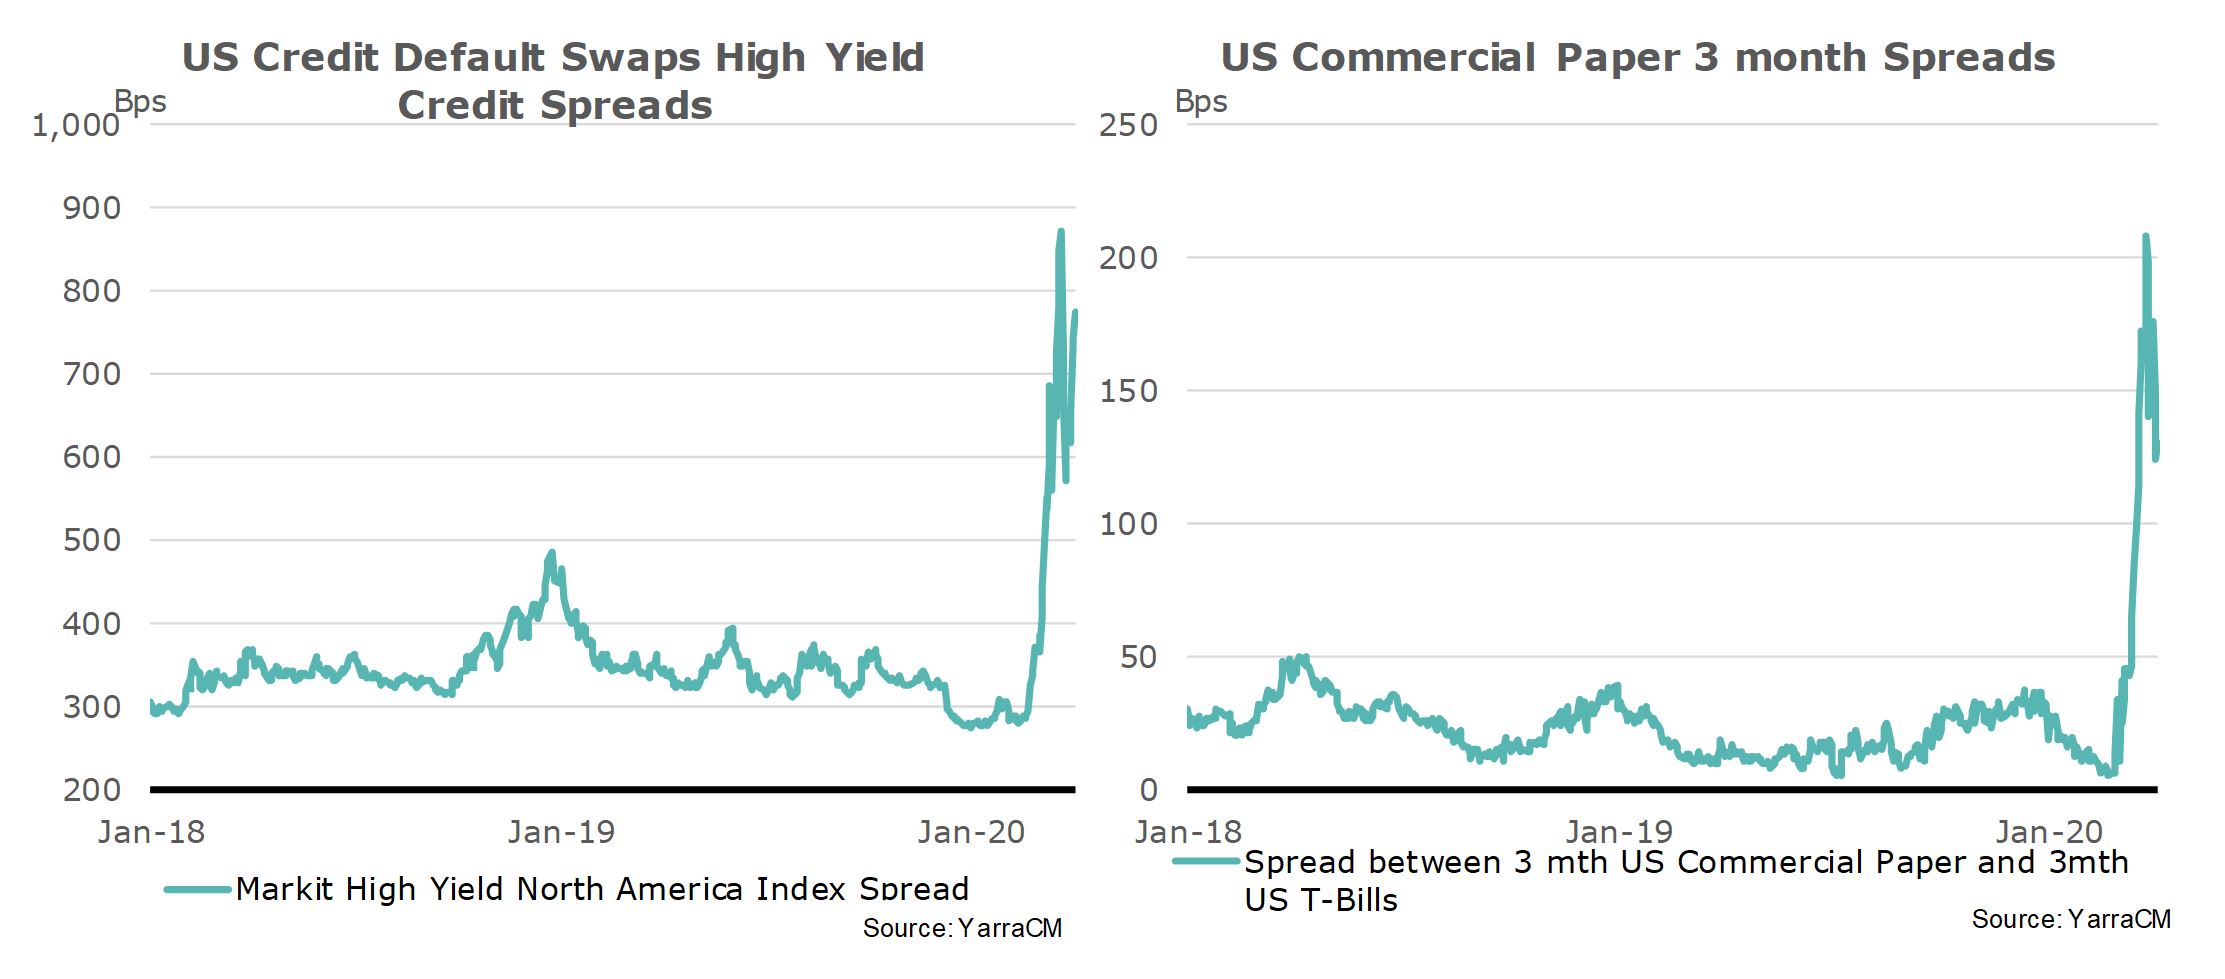
Thirdly, the central banks around the world have been far more aggressive in stabilising stress in financial markets earlier in the crisis. Commercial paper spreads, high yield credit spreads, and bid-offer spreads in US treasuries have all narrowed in recent days as the central banks flood markets with liquidity and expand their programs to provide troubled asset relief.
We are not out of the woods yet, and we attribute an 80% probability to a relatively short but deep industrial activity recession and a 20% probability to the recession mutating into a longer, more painful debt deflation cycle.
5. Will the cost all be worth it in the end?
The Australian Government and the Australian people should be commended for their collective actions in “flattening the curve”. There is no doubt that it has already saved many Australian lives.
If we are correct in our economic projections, the economic cost of COVID-19 is approximately $136bn of lost activity in 2020, or $5,300 for every Australian man, woman and child. To place that in context, GDP per capita was $75k in 2019 and if that falls to $69.6k it will be at its lowest level since 2011. In other words, eight years of expansion of living standards of the average Australian will have been eliminated in a matter of months.
There is also an intertemporal aspect to the crisis in that it places the burden of servicing the accumulation of government debt to fund the fiscal package on future generations, not to mention the fiscal drag that will act as a headwind to economic growth should the objective of reaching a balanced budget be retained in the future. Who pays for the vast sums of Government debt?
At current low bond yields, the likely new debt issuance amounts to less than $2bn per annum in interest, but should bond yields eventually rise to approximate nominal GDP growth, as they have throughout history, then the additional interest charge could exceed $12bn per annum.
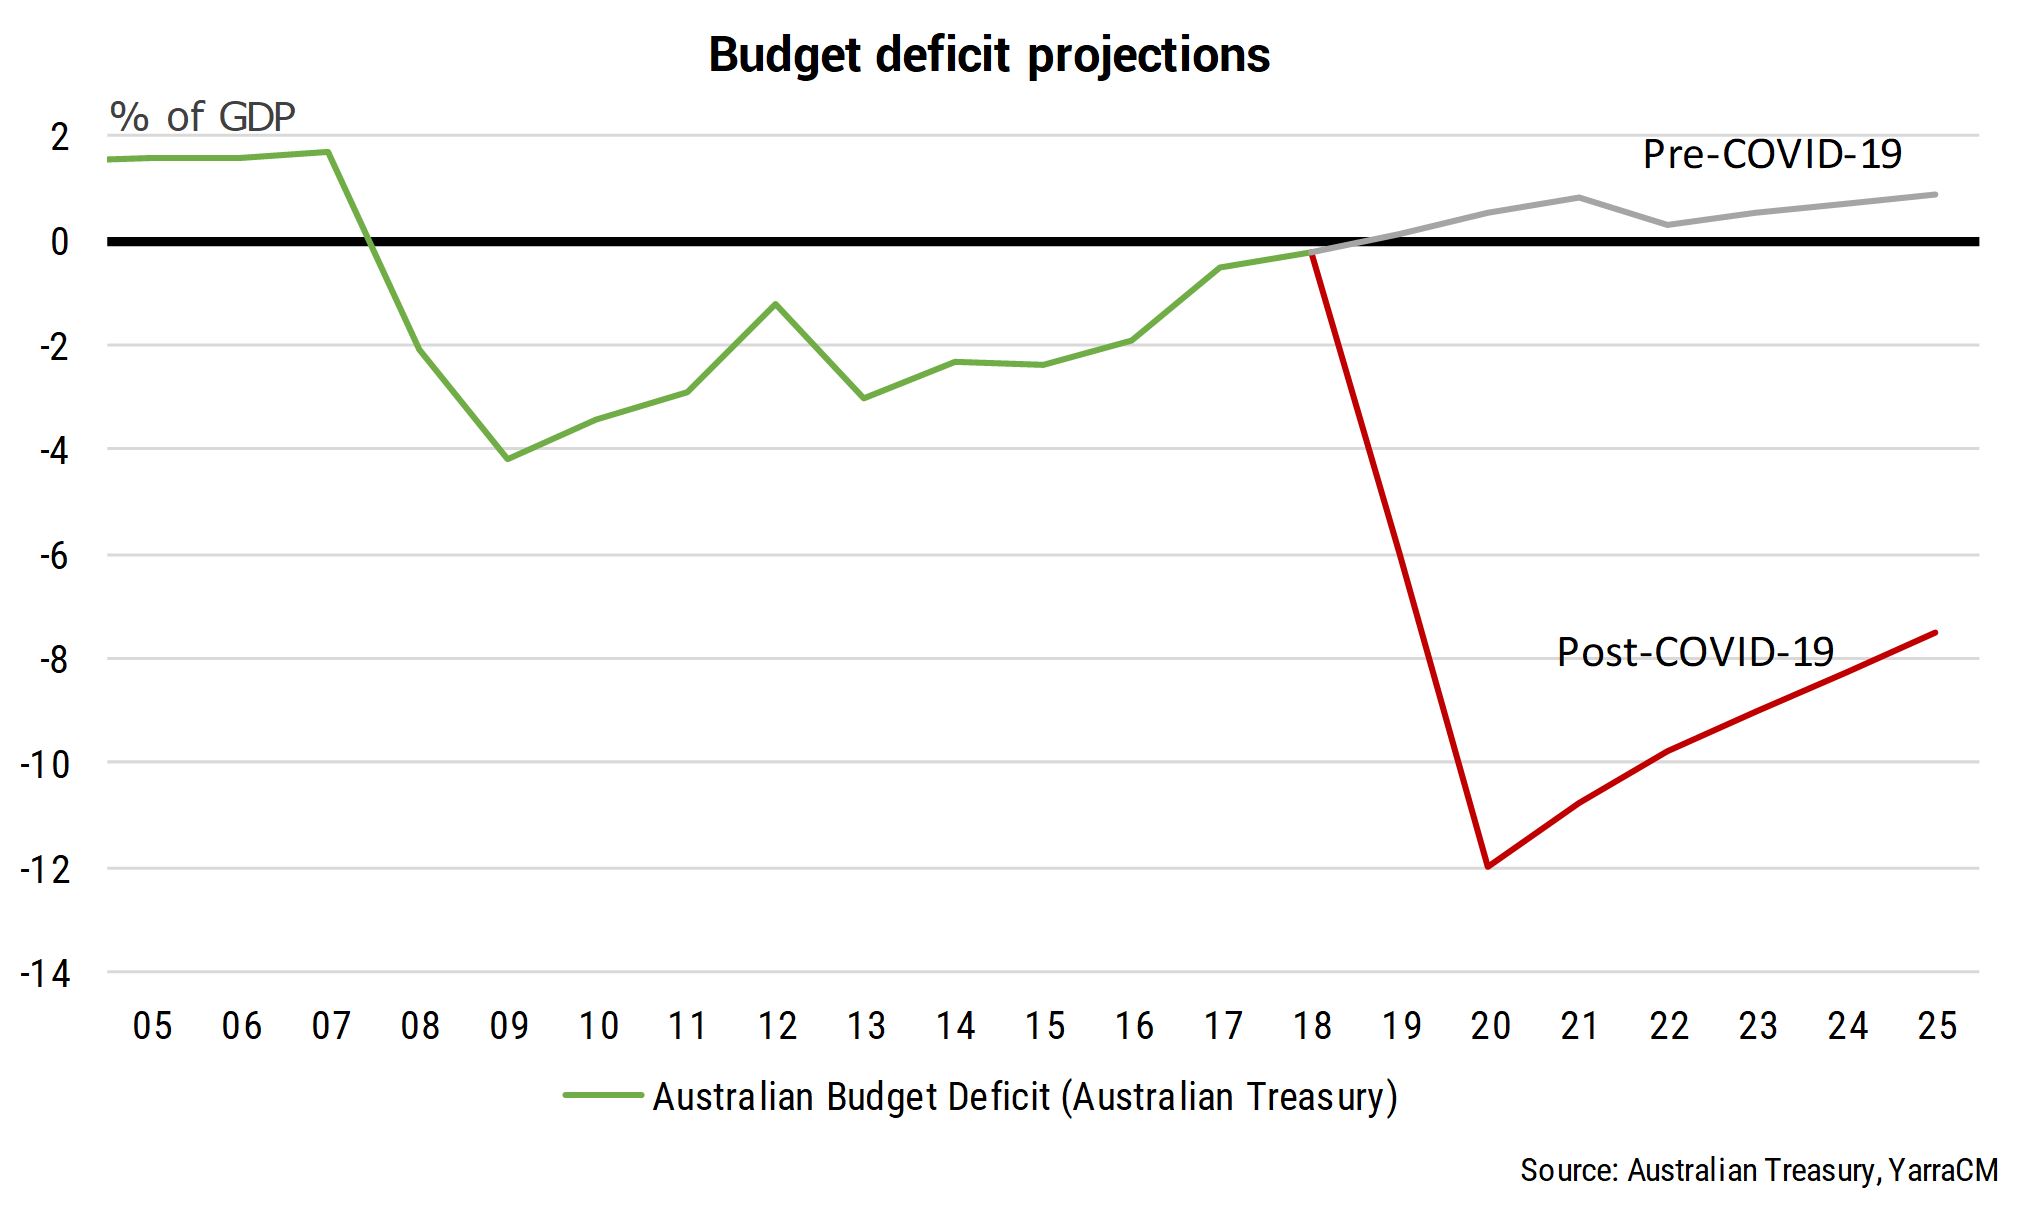
More importantly, one of the most important reasons why most developed nations have failed to achieve their potential growth rates post the global financial crisis (GFC) was the headwind created as governments’ attempted to reduce the large Budget deficits recorded during the GFC to more sustainable levels. Indeed, it is hard to imagine that the Australian Budget deficit will remain below 14% of GDP by the conclusion of 2020 given both the size of the fiscal package and the size of the economic recession at hand.
The long road back to a surplus can only be achieved by the government raising more in taxes than it returns via spending. By necessity, a sustained fiscal drag which reduces economic growth between 0.5%-1.25% per annum will be the new normal for the next decade. Once the COVID-19 crisis has passed, governments of all persuasions will soon turn their eyes to the taxes they can raise and the benefits they can reduce.
The alternative will be to eschew current economic orthodoxy and move down the Modern Monetary Theory (MMT) framework. For many, this option is suddenly looking like the path of least resistance. While we doubt the RBA will lead the global MMT experiment, with the Fed and Bank of England already engaging in a modest form of MMT and faced with the choice of a decade or more of fiscal repression, the temptation for Australia to follow the global lead towards MMT may yet prove overwhelming.
Regardless of whether Australia makes that ideological jump, when we look back at the current episode in three years and sum the economic cost, one of the key learnings will be that the response to future pandemics simply cannot be the same. Australia is one of the richest and best resourced nations on the planet, yet even we cannot afford to repeat this particular episode.
