


By Dr Erin Kuo-Sutherland (Chief Sustainability Officer), Sharanaa Jayaroopan (Investment Analyst), Hugh Morgan (Senior Investment Manager), Marcus Ryan (Portfolio Manager), David Schwartz (Investment Manager), Michael Steele (Co-Portfolio Manager), and Ed Waller (Deputy Portfolio Manager).
Water is one of the most talked-about and least understood risks in a portfolio. In 2026, we set out to build a practical way to assess it. We broke water risk into five types, each linked to how it can show up in a company’s financials. We then built a three-step process to narrow a broad investable universe to the few companies where it is likely to matter. What we found is that in a normal year, water is rarely the main driver of an investment thesis. However, the risk is concentrated in a few sectors and can become material quickly in an extreme year, which makes it a case for targeted analysis. This paper shares how we built that framework.
In brief
- Five pillars of water risk: (1) Quantity & Access, (2) Discharge & Liabilities, (3) Social Licence, (4) Supply Chain, and (5) Flood & Physical.
- A three-step process: (1) identify priority sectors top-down, (2) test materiality bottom-up, and (3) assess management’s response.
- The result is a framework that helps us prioritise where risk may sit: Most companies screen out early, which lets us spend our analysis and engagement time where water risk could change the investment case.
Why Water is Challenging for Investors
Water is essential to almost every business, yet it rarely appears as a discrete line item in financial statements. Four features make it particularly difficult for investors to pin down:
- Water is local. Water is shared within a catchment, the area of land that drains into the same river system or aquifer, so every user there draws on the same finite supply under the same rules. A megalitre in the Murray–Darling is thus not a megalitre in the Pilbara, and exposure cannot be netted across a portfolio the way a carbon footprint can (refer Figure 1).
- Water is shaped by policy. Access is licensed, allocated and traded under rules that can tighten when water is scarce, and different basins have differing water governance.
- Water risk can materialise quickly. A drought can reduce water entitlements or allocations within a season, and a flood can close a site in a day.
- Water is often poorly disclosed. When companies do report on it, it can be reported as group-level volumes that say little about where the risk actually resides.
For Australian investors, none of this is abstract. The Murray–Darling Basin generates around 40% of the gross value of Australia’s agricultural production and supplies water to more than 2.4 million Australians.[1] The February–March 2022 east coast floods were the costliest floods in Australia’s history, with insured losses estimated at over A$5.8 billion across more than 240,000 claims.[2]
Drought has also stopped production outright. During the Millennium Drought, annual NSW rice production fell from around one million tonnes to just 19,000 tonnes, resulting in SunRice closing its Deniliquin mill in 2008. It did not reopen until 2011[3]. When water ran short again in 2018, SunRice announced at least 100 job cuts at its Deniliquin and Leeton mills. And in the 2019 drought, towns including Tamworth and Dubbo came close to ‘Day Zero’, when town water supplies were at risk of running out. The meat industry warned that local processors might be forced to cut production.[4]
In our May 2025 paper Reframing Net Zero we set out our base case of warming above 2°C, with more frequent and severe physical impacts. Water is one of the most direct ways that reality can show up in company earnings. Looking ahead, CSIRO and the Bureau of Meteorology project longer droughts in parts of southern and eastern Australia, and more intense short-duration heavy rainfall, even as average rainfall declines.[5] This is likely to be exacerbated by seasonal and climatic variations, such as El Niño which has historically been associated with hotter, drier conditions in large parts of southern and eastern Australia.
So, for investors, the question is less whether water matters and more where, when and how it could affect a company’s valuation, a position size or our engagement priorities.
Figure 1. Why water is not carbon

Source: Yarra Capital Management.
Building a Practical Framework: Five Pillars of Water Risk
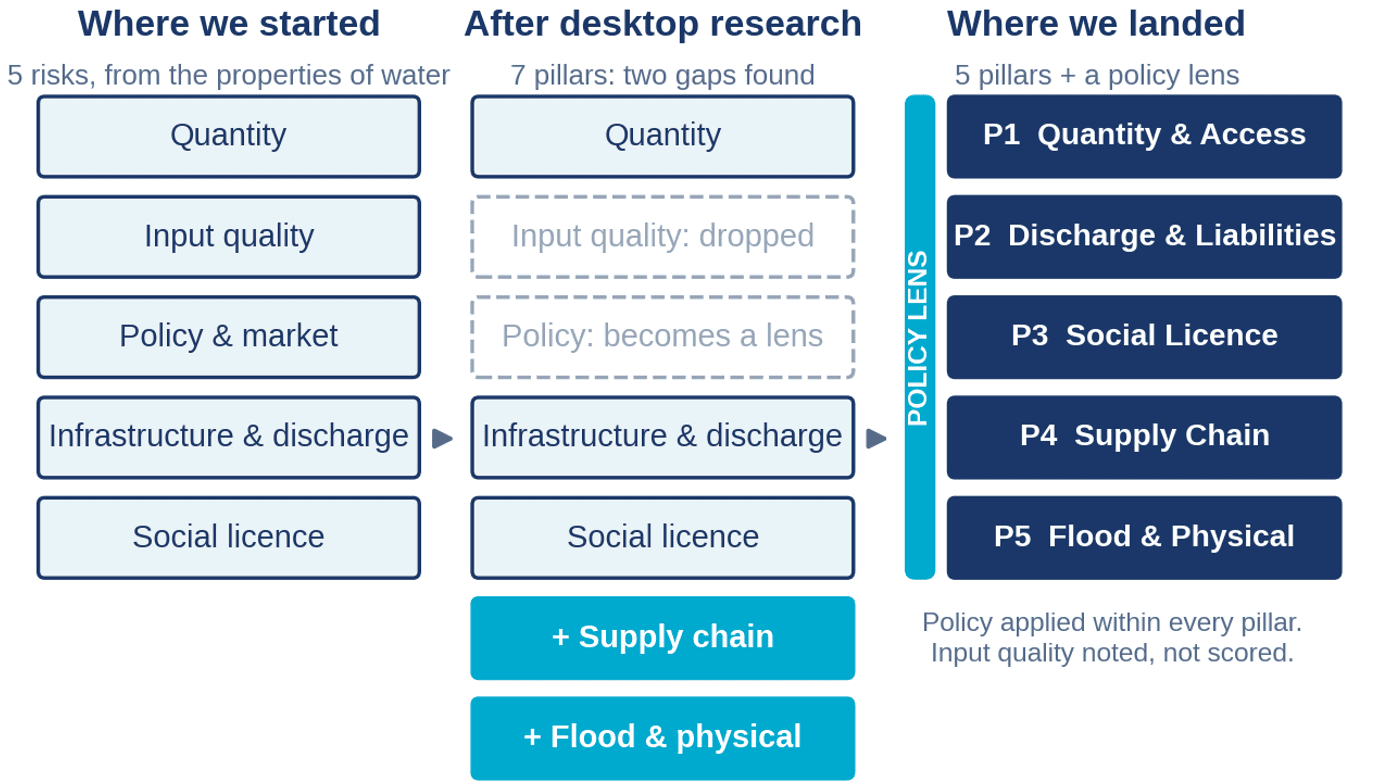
We started from the properties of water and examined what can go wrong for a business that depends on water. That gave us an initial set of five risk types: quantity (is there enough reliable water?), quality (is it fit for use?), policy and market (who may use it, and at what price?), infrastructure and discharge (what does it cost to treat, release and remediate?) and social licence (will the community accept the use?). These were our starting points, not the final pillars.
When we tested these five risk factors against real companies, we found two gaps. For a quick-service restaurant, the water that matters is embedded in what it buys, such as beef, dairy and produce, not what it uses in store. So, we added supply chain as a sixth type of water risk. For miners and property owners, the most direct financial hit came from too much water, not too little: floods that halt production, damage assets and reprice insurance. Accordingly, we added flood and physical risk as a seventh risk.
Two of the seven risk types did not retain a separate score. Our pilot study found that input quality was rarely material: the companies we examined typically treat water on site, so poor quality became a cost (often minor) rather than a constraint. We still note it where relevant. Policy turned out to be everywhere, shaping every other pillar (refer the policy lens in Figure 3). Scoring it on its own meant counting it twice, hence we now apply policy as a lens within each of the five pillars (refer Figure 2).

Figure 2. How the framework evolved
Source: Yarra Capital Management.
Figure 3. The five pillars of water risk

* Yarra internal estimate from our A-REIT flood model; indicative only. Part 2 quantifies these channels for our pilot companies. Source: Yarra Capital Management.
We then used the five pillars as a lens in a three-step screening process, with each step narrowing the list of companies that require a closer look.
- First, we looked across sectors to see where water risk was likely to be highest;
- Second, we tested whether that risk was material for individual companies; and
- Third, we assessed how well management was responding.
Step 1: Identify Priority Sectors Top-Down
With the pillars defined (refer Figure 3), we selected 11 sectors where our team expected water risk to be elevated. Informed by top-down research, we mapped each sector against each type of water risk as a first-pass hypothesis. The heat map is deliberately coarse, rated High, Medium or Low. It is a starting point rather than a final verdict. Its job is to show us where to look: which sectors depend heavily on water or have a large impact on it, and through which pillar.
What it is unable do is tell us which company is exposed, since sector averages hide the relevant detail to assess risk. It did, however, indicate where to select pilot companies for deeper research. From the first-pass map we chose seven priority sectors with potentially financially material water risk (refer Figure 4). Each sector analyst then nominated one or two pilot companies where we expected to find water risk, giving 11 pilot companies in all.
Our first-pass list also included banks and insurers. Both carry water risk, but largely indirectly: banks through the loans they make to exposed borrowers, and insurers through the claims they settle after floods and storms. We concluded that this exposure sits in their customers’ value chains rather than their own operations, and that insurers’ exposure is difficult to assess reliably from public disclosure. We therefore did not prioritise Financials in this pilot. We believe their risk can be assessed as a read-through from the sectors they finance.
Figure 4. First-pass heat map of our seven priority sectors (illustrative)

Legend: H = high, M–H = medium-high, M = medium, L = low indicative potential materiality (a judgement, not a probability estimate). Judgement-led first-pass read, shown to illustrate the method; how the ratings changed on closer analysis is reported in Part 2. Source: Yarra Capital Management.
Step 2: Test Materiality Bottom-Up
Next, we conducted a desktop assessment of each pilot company. It drew on filings, sustainability reports, CDP (formerly the Carbon Disclosure Project) data, disclosures aligned with the Taskforce on Nature-related Financial Disclosures (TNFD), third-party data and our own models. Two patterns stood out early on:
- Risk and evidence require separate ratings. Each pillar is scored for the size of the risk and, separately, for our confidence in the evidence (High = company-disclosed; Medium = credible third party; Low = analyst inference or a gap). A high-risk rating derived from minimal evidence would be something to test further, rather than a conclusion.
- Disclosure often cannot answer the questions that decide materiality, so gaps are likely to lead to engagement. Which specific assets sit in a floodplain? How secure are a company’s water entitlements in a dry year? Is a remediation liability fully provisioned?

Step 3: Assess Management’s Response
Knowing how exposed a company is only tells us half the story. Two companies with the same high flood exposure can warrant opposite responses, depending on how well each has prepared. Therefore, we also assess a second dimension, management posture, on a six-rung ladder (refer Figure 5). It is adapted from established water-stewardship frameworks, including those of the World Wide Fund for Nature (WWF),[6] the United Nations Global Compact CEO Water Mandate,[7] the International Council on Mining and Metals (ICMM),[8] CDP[9] and the Alliance for Water Stewardship (AWS).[10]
We assign each company a rung based on the available evidence, starting with company disclosures and then credible third-party sources. Where the evidence is mixed or uncertain, we place the company on the lower rung rather than give it the benefit of the doubt. Where there is insufficient information to judge, we flag the company for engagement to clarify its posture. Posture is assigned subjectively, based on the information available, and confirmed through peer review and team discussion, drawing on all available engagement insights.
Figure 5. The management posture ladder

Source: Yarra Capital Management, adapted from WWF, CEO Water Mandate, ICMM, CDP and AWS maturity frameworks.
Putting the two together helps us decide what to do (refer Figure 6). Where high exposure meets a weak or unclear management response, engagement is most likely to be worthwhile. Where a highly exposed company is already well prepared, we are more likely to keep watching than to escalate. Companies at the top of the ladder may also warrant engagement to test leading practice and identify lessons that can be shared across the portfolios.
Figure 6. Exposure × posture: from assessment to action

Source: Yarra Capital Management.

Deciding What to Do, and Right-Sizing Our Role
We find frameworks to be most useful when they help us focus our time where engagement can uncover useful information, inform an investment decision or let us share our views on a material issue. Our water framework concentrates that effort where high water-risk exposure meets a low or uncertain posture. We take a ‘monitor’ stance where risk is lower and revisit it as conditions change.
Having a prioritisation framework like this matters, because our time and resources are finite. The framework also clarifies what is reasonable to expect of:
- Companies: disclosure that helps investors make decisions, rather than perfection. That means site-level data for material sites, the volume and reliability of water entitlements, the flood design standard of key assets, the basis for water-related provisions, and how suppliers in stressed basins are screened.
- Investment analysts: we don’t expect investment analysts to become hydrologists. We do want our teams equipped with sufficient knowledge to understand what type of risk applies, to be able to assess whether it is financially material, and to flag when the evidence is insufficient to judge and may warrant more work or an engagement.
- Investors (including ourselves): to ask for decision-useful disclosure, to understand management’s response of material inherent risks, and reflect water risk in valuations where it is material. We can support better system-level standards, such as ISSB-aligned reporting and the TNFD framework, and take part in collective initiatives where they add to our understanding. Water also connects to our wider ESG work, including our climate strategy and our positions on human rights (including community and First Nations water rights), nature, and modern slavery in supply chains. We are beginning to work through all of this, building on this pilot approach to understanding water risk.
The Result: A More Focused List
Applied end to end, our water risk framework has helped us narrow the field in a way a broad thematic view could not. It starts from a broad investable universe of approximately 300 companies (the ASX 300). The top-down map identified seven priority sectors, and analysts nominated 11 pilot companies. The bottom-up review then left nine companies where water risk is likely to be material, and seven where engagement could add to our insights and views. Since pilot companies were chosen where we expected to find water risk, this hit rate is not an estimate for the wider universe.
Figure 7. Narrowing the universe

Source: Yarra Capital Management.
Most companies screen out early, not because water is irrelevant, but because under normal conditions it is unlikely to be sufficiently material to change the investment case. We also recognise that water as a theme will create beneficiaries and tailwinds for some companies, such as providers of water treatment, efficiency and infrastructure. We are monitoring these opportunities but believe it is too early to undertake detailed analysis for listed Australian companies.
What We Learned Building It
First, start simple and let the evidence reshape the framework. Our five risks became seven, and then five again.
Second, separate what you know from what you suspect. Scoring the risk and the evidence separately stops an educated guess being mistaken for a finding.
Third, verify the first pass. AI-assisted, human-led desktop research sped up screening, but every output needs a human to verify its accuracy and integrity, and even then, the information is imperfect.
Fourth, look at the asset, not just the ticker. Physical risk often sits at individual sites, and group-level averages can hide it.
Fifth, sector heat maps are a useful starting point. Understanding where the company operates and how it runs its business will shape the actual risk.
Lastly, initial concerns can ease on engagement. Our engagements typically filled in information gaps, in most cases leading to an overall reduced risk rating.
Next: Applying the Blueprint (paper 2 of 2 in the water risk series)
Of course, a framework only proves its worth once it is put to use. In Part 2 we report the findings from when we ran our pilot companies through the blueprint: where water risk proved material, where engagement eased our concerns, and which risks could surface in an extreme drought or flood year. We also set out what changed in practice: our risk views, our engagement priorities, and what we now monitor.
+++
[1] CSIRO, Enhancing water security in the Murray–Darling Basin (primary; accessed September 2026).
[2] Insurance Council of Australia estimate, reported by Reinsurance News, 19 April 2023 (secondary). Refer also ICA, 2022 flood now third costliest natural disaster ever, 28 June 2022.
[3] Australian Food News, SunRice to reopen Deniliquin rice mill, 4 November 2020.
[4] FoodNavigator, Water crisis causing meat processing disruption, 1 October 2019 (secondary).
[5] CSIRO and Bureau of Meteorology, State of the Climate 2024: Future climate (primary). Also: Bureau of Meteorology, Climate Driver Update, 13 October 2026 (primary).
[6] WWF, Steps to better water stewardship (water stewardship ladder).
[7] UN Global Compact, CEO Water Mandate.
[8] ICMM, Water Stewardship Framework and Water Stewardship Maturity Framework.
[9] CDP, Water Security Scoring Methodology 2025.
[10] Alliance for Water Stewardship, AWS Standard.



0 Comments