By now, people whose eyes don’t immediately glaze over once discussions of personal or national budget are broached are well aware of an upcoming spike in their electricity and gas bills. However, for the majority of the Australian citizenry the ‘sticker shock’ from the increase in utility bills will still be felt in real time. Tim Toohey, Head of Macro and Strategy, details why for many Australians this will merely compound an already dire cashflow situation.
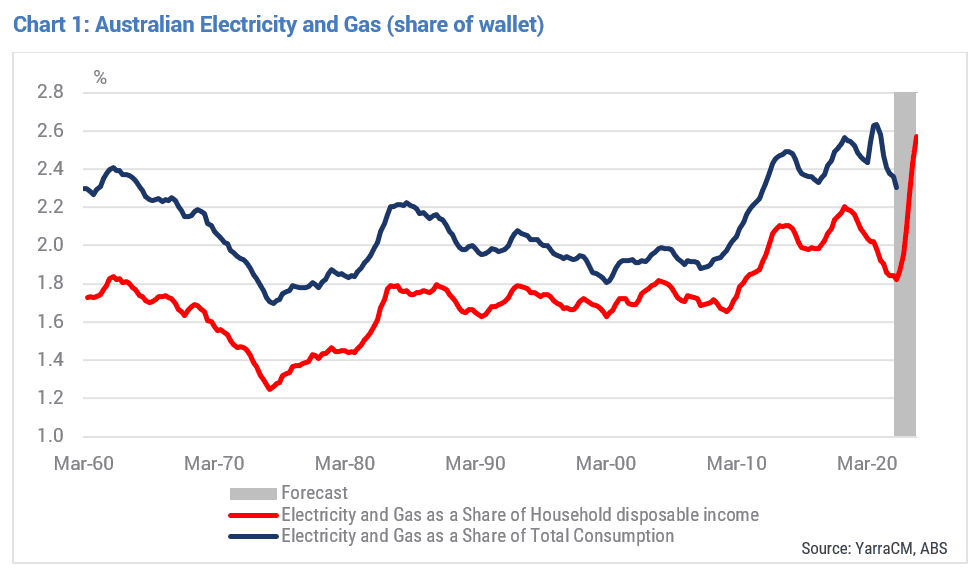
For context, the Australian Treasury has assumed that electricity prices will rise 20% (y/y) by late 2022 and a further 30% in 2022-23. This will take utilities to an unprecedented share of wallet in 2023, some 2.6% of household income by Dec 2023 (refer Chart 1). While that may not sound like a particularly scary figure, it’s 25% above the 10-year average and 49% above the long run average dating back to 1960. It will also represent the biggest one year rise in utility bills in the post-War period.
The cause for the spike has been well documented. A surge in global coal and energy prices in reflex to the invasion of the Ukraine was the dominate force, some unfortunate timing of coal-fired power station maintenance and some less than transparent behaviour by market participants all played a role. Yet the cause of the trend rise in utility costs is less well understood at the household level; the rapid transition to renewables is unravelling the economics of running coal and gas-fired generation at an even more rapid rate.
This is not to say that decarbonising the grid in an expeditious manner is not necessary or desirable. It merely means that the cost of the transition will be felt well beyond well-heeled investors asked to dig deep into their pockets to finance the capital cost of the transition. Indeed, it is the consumer that will invariably be forced to pay for the potholes in the road to decarbonisation as firms seek to recover the cashflow hit from declining economics of traditional generation via higher power bills.
Utility companies know this. Politicians should know this. Households largely have no idea that they are ultimately on the hook if best intentions of a smooth energy transition turn to custard somewhere along the journey.
To overwork the analogy, we have barely gotten the car out of the driveway with a long journey ahead to a known destination but without a clear map of how to get there. We don’t have enough cash in our wallet to complete the journey, some of the roads have not yet been built, and the kids who have been fighting politically for years before getting in the car are continuing to do battle in the backseat.
For those of us scarred from family car trip holidays at this time of year, we are collectively at the point where optimism and excitement at the start of a trip are about to be overwhelmed by the reality of a long-haul car trip in the Australian heat. The feeling of sizzling hot car seats, the taste of Aerogard inadvertently sprayed into a protesting mouth and the injustice as youthful back seat rebellion is brutally supressed by the front seat elites.
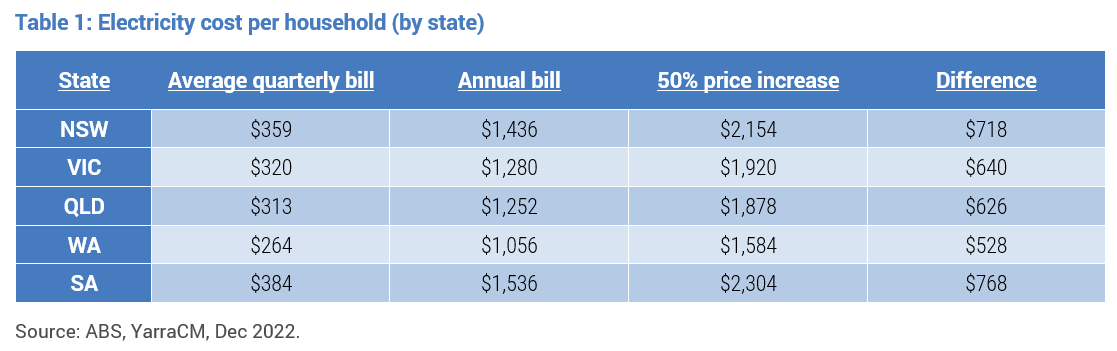
Yes, it’s going to be a long and painful journey. But to get a sense of who will bear more of the cost, we can look at the average quarterly electricity bill across different dimensions.
Geographically, households in WA on average have lower power bills and for any 50% national price increase will be roughly $240 p.a. better off than their SA cousins (refer Table 1).
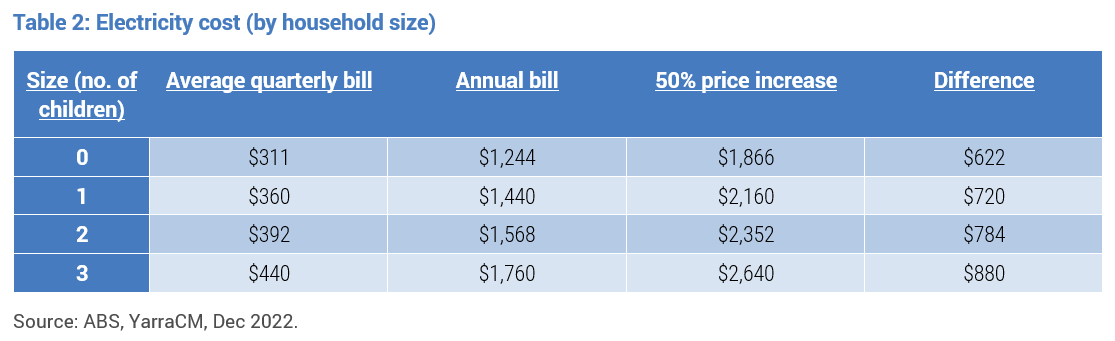
By household size (refer Table 2), the more children you have the greater the power bill increase (and the more time the parent spends wandering around the house turning off lights left on by their children).
By age, it’s the young that will feel the pain more acutely (refer Table 3). Indeed, Gen Z (18-24yo) power bills will swamp the bills of Baby boomers (60+) by $150 p.a. Yes, despite the moral superiority of youth, it seems it takes more power to fuel video gaming sessions in the wee hours and to charge the armoury of devices required to keep your social media presence tip top!

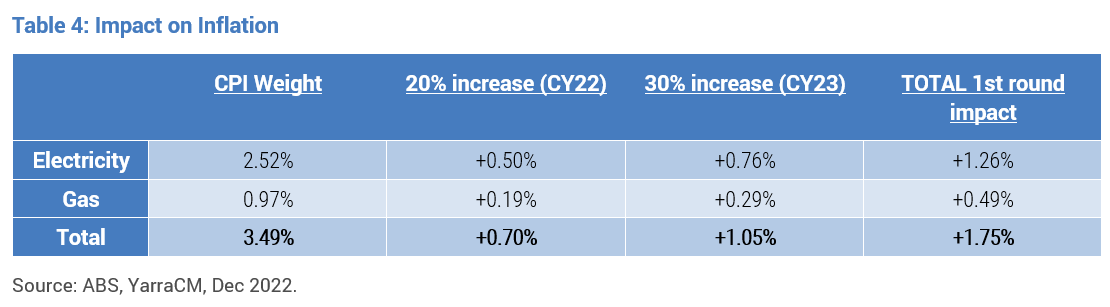
From the perspective of a top-down economist, the addition increment to inflation from rising power and gas bills could add 1.75% to inflation by the end of 2023 in first round impacts and potentially a further 0.35% in second round effects (Refer Table 4). That’s a lot, but that’s an average estimate. From the perspective of young households with multiple children living in the Eastern States, the impact will be larger and more painful.
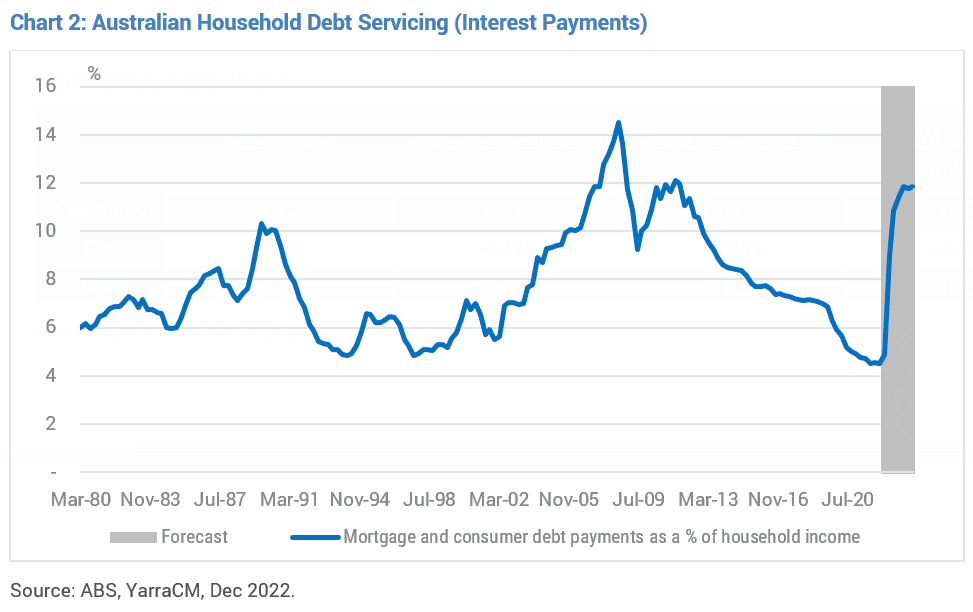
Worst still, this is the slice of the population that are most at risk of rising education, health, insurance and housing costs. We all know that the interest payments on the stock of existing total household debt are set to rise incredibly sharply in 2023, compounded by the roll off of fixed rate mortgages (refer Chart 2).
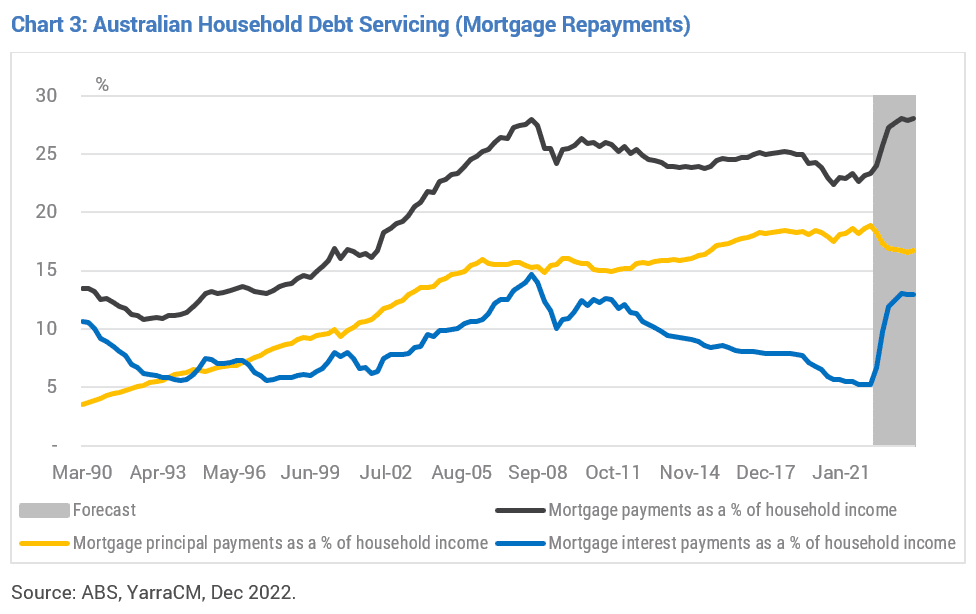
In conjunction with principal payments, debt servicing for the average household is set to breach the prior record during 2023 (refer Chart 3). Again, this is for the average household. The situation for young mortgaged households is far more dire, not to mention a rising proportion of the recent new homeowners who are now entering negative equity scenarios for their homes.
This will place an enormous impost on a large section of society. Nobody likes having their discretionary income squeezed and nobody likes an unexpected spike in their gearing ratio via falling asset prices. Even if we assume the ongoing robust growth in wages and employment in 2023 the impost of higher interest costs, utility costs, insurance costs and rents will be sufficient to see average discretionary cashflow fall by 15% by mid-2023 (refer Chart 4), and much more for young households with large families and large mortgages.
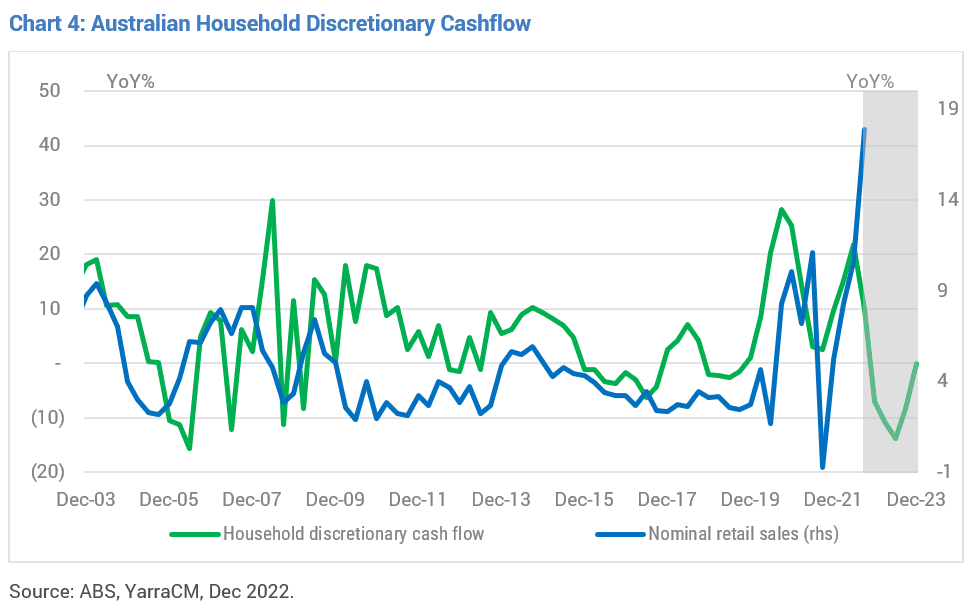
Given, retail sales growth normally closely tracks our measure of discretionary cashflow, we expect that retail sales will slow from the rapid rate of close to 20%(y/y) to zero growth by mid-2023. Note, this is likely the best-case scenario. It could easily be worse if sub-trend economic growth reveals labour market weakness with a lag, as observable in all prior downturns.
The argument that Australians have accumulated ‘buffers’ via $260bn in ‘excess savings’ since the pandemic and via pre-payments on mortgages will exceed additional interest payments – for most borrowers at least – is illusionary.
While this might be true in an accounting sense, the RBA is likely asking itself the wrong question. It is not a question of how big a ‘buffer’ is before tightening policy will hurt, it is why did households accumulate such a buffer in the first place? And is the economic outlook improving or deteriorating?
Excess fiscal stimulus obviously contributed to the initial saving spike, but what if the ongoing accumulation of savings was more about de-risking asset exposure in an uncertain time or because a large cohort of the population is simultaneously entering retirement (COVID may have expedited this decision for many Baby Boomers).
If this is the case, then the ‘excess saving’ is not suggestive that a consumption boom lies ahead that threatens future inflation. Quite the opposite: in times of rising economic uncertainty households tend to initially lift their saving rate. They do not decrease it.
There has been ongoing debate whether the government has a role to play in capping utility costs. And, if so, whether that should be at the company level or the consumer level. Given the recent history of firms profiteering through the crisis by lifting prices rather than absorbing margin pressure and the impending cashflow hit for households, the answer should be obvious.
More importantly, if the government wants to keep everyone in the car playing nicely during the initial phase of the energy transition, then the answer is very much yes: utility costs need to be controlled. Let’s just hope that there are enough fiscal resources and goodwill to get us to that new energy destination as quickly and efficiently as possible.


0 Comments