


The RBA’s case for keeping policy tight and threatening further interest rate tightening rests on one main conclusion: the economy is still running with excess demand. Misidentifying a bout of inflation as demand-driven and responding with material policy changes has large negative consequences for interest sensitive households and businesses. However, the RBA recently acknowledged that their strike rate of correctly identifying demand-led vs. supply-led bouts of inflations in real time is a two out of three proposition. That is not great odds. It also begs one obvious question: have they got it right this time?
In this article we do two things.
Firstly, we replicate the analysis the RBA uses to split inflation pressures into demand or supply led factors. We find that the RBA are likely attributing too many items by number to the demand-led inflation. More importantly, we conclude that the largest components driving this demand-led inflation have fingerprints of government decisions (i.e. subsidies, fees and taxes), distorting the statistical classification. The result is a large overstatement of demand-led price pressures in the Australian economy.
Secondly, we extend the same statistical analysis beyond the consumer to the whole economy to help identify the underlying source of inflationary pressures. Our conclusion is that there is excess demand, but it is not coming from the parts of the economy that sell to households. The household-facing industries make up half the economy. Since mid-2023, demand in those industries has added just 0.05 percentage points a year to economy-wide producer prices.
The demand pressure that the RBA is concerned about comes from two places that monetary policy struggles to reach: (i) the government-funded non-market sector; and (ii) the imported component of the CPI basket. The RBA’s objective is obviously focused on consumer prices, but we show that a fuller analysis of price pressures across the economy reveals that price pressures are coming from the sections of the local and global economy that the cash rate cannot hope to possibly influence.
This is principally a failure of government policy at home, leaving the RBA pushing against domestic households and businesses that are not the source of excess demand, and households are literally paying the price for it.
Replication of the RBA’s demand-driven inflation methodology raises some key questions
The RBA has borrowed heavily from Adam Shapiro’s (the San Francisco Federal Reserve) framework to identify whether inflation is being driven by demand or supply forces. Its basic premise is to label a price change as demand-driven when prices and volumes move together, and supply-driven when they move apart. Iao and Shabalina from the RBA apply a very similar technique to 18 CPI categories in their 2026 RBA Conference paper presented at the recent RBA conference.
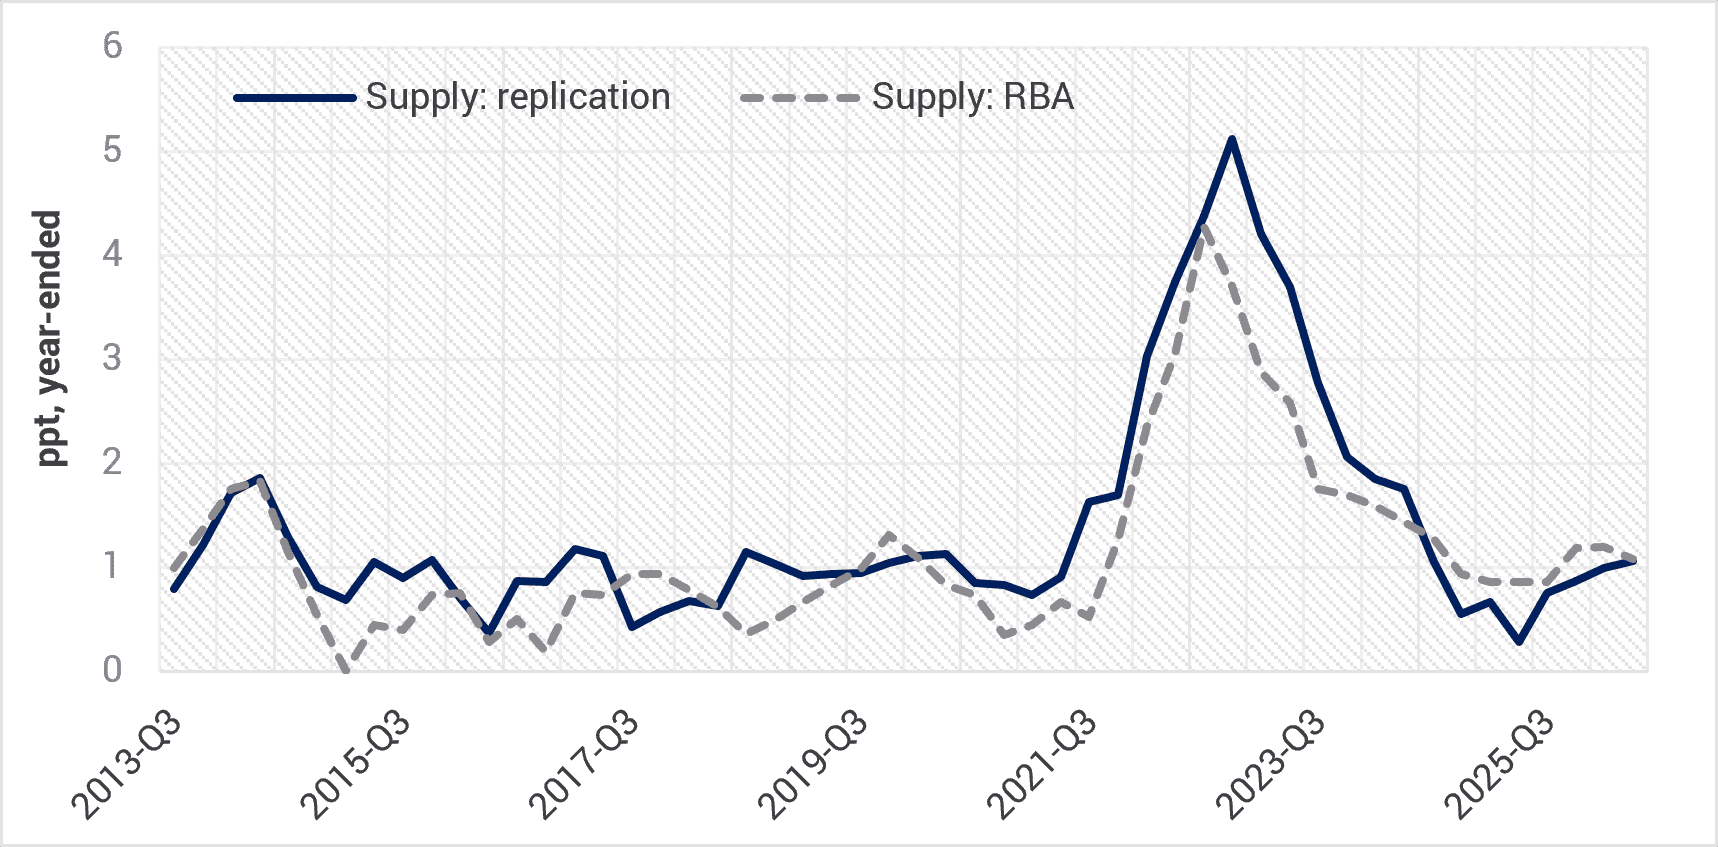
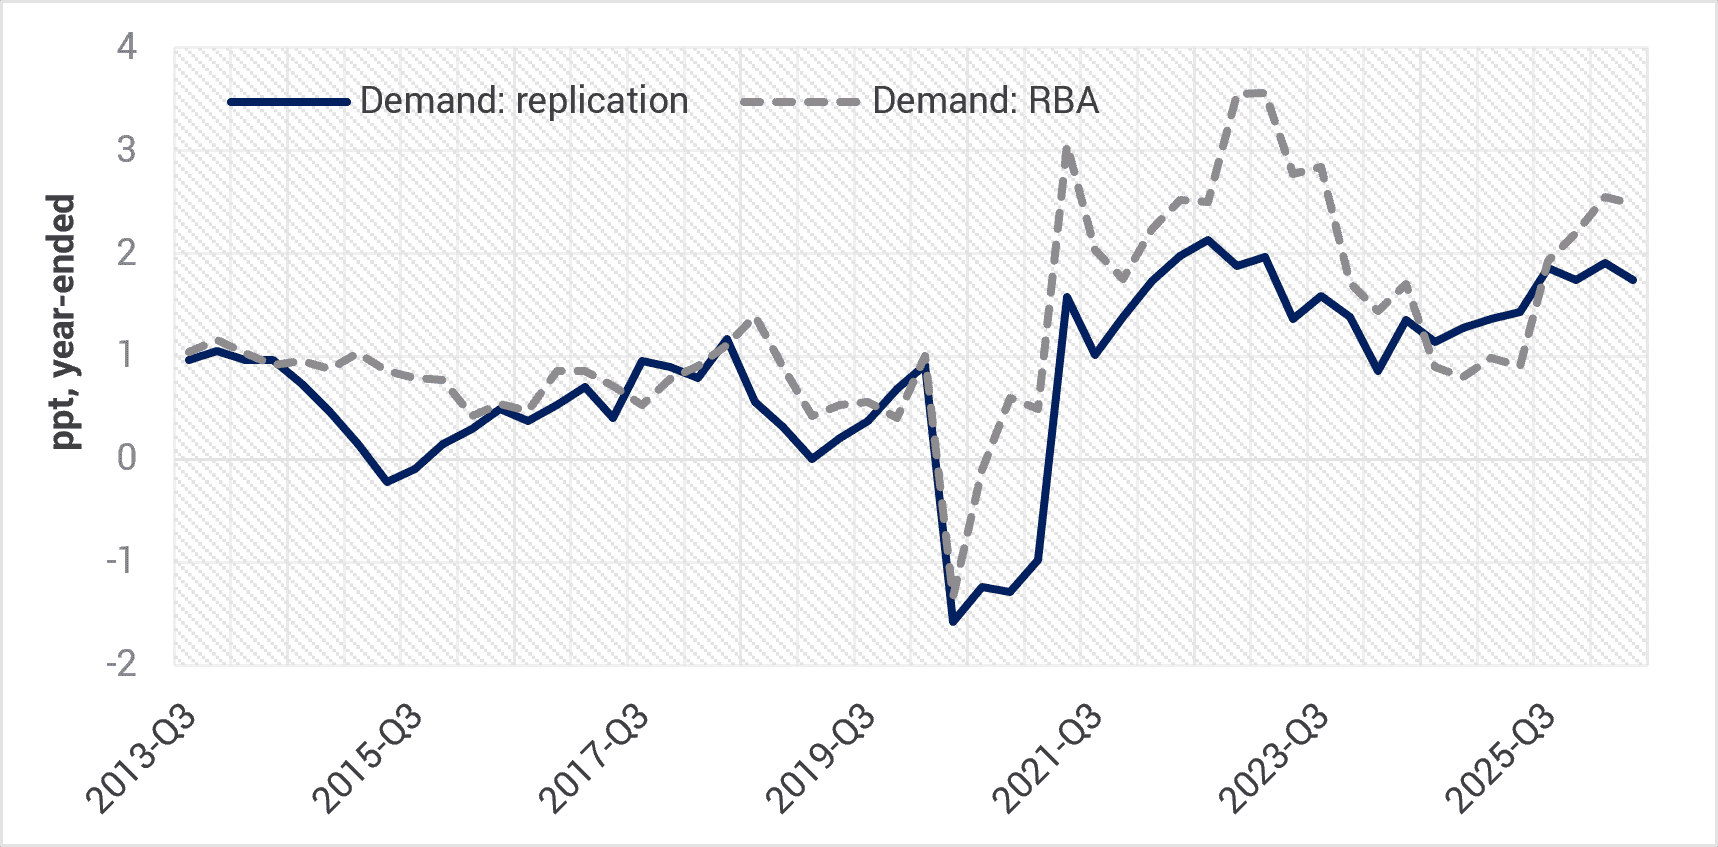
There is some complexity in conducting this type of analysis, and not all of the information required to fully replicate the RBA approach has been disclosed. Nevertheless, when we recreate the analysis (refer Figures 1 and 2), we are able to closely match the RBA’s identification of supply pressures in the CPI. However, a strict interpretation of Shapiro’s approach results in fewer items being formally attributed to demand pressures and a less cyclical path through time of those demand pressures compared to the RBA’s analysis. In practical terms, our approach matches the RBA on the supply shock identification, but when it comes to demand shock identification our approach attributes more items to the ‘ambiguous’ category.
With the benefit of hindsight, this would have argued for not easing interest rates in 2025, given our modelling shows a much smaller slowdown in demand led inflation through 2025 compared to the RBA’s approach. Although demand pressures have risen into mid-2026, our estimates also suggest a less aggressive rise compared to the RBA’s approach. By inference, there is currently also less need to curtail demand pressures in the domestic economy via more aggressive policy tightening.
Fig 1. Supply-driven contribution: YCM replication vs RBA
Source: YCM, RBA, Oct 2026.
Fig 2. Demand-driven contribution: YCM replication vs RBA
Source: YCM, RBA, Oct 2026.
What the RBA analysis does not tell us is which spending categories are currently providing the strongest contributions to this demand-driven inflation? Note that this is purely a statistical exercise which is attributing a spending category to a demand shock when price and volumes move in the same direction. A commonsense overlay for when government policies were clearly a key factor impacting prices is not being made. For instance, it is surprising that the spike in electricity prices in 2025-26 from the removal of temporary government subsidies is captured as the largest contributor to demand-driven inflation under the RBA’s framework (refer Figure 3). However, this was purely an artefact of aggressive policy intervention, not rapid shifts in consumer demand for electricity.
Dwelling investment is the second biggest contributor. This might well be mostly demand-driven in response to interest rate cuts in 2025 helping to bring forward activity, a message consistent with building approval and lending data. However, there was also an element of (i) structural under supply of housing, in part due to government policy failure, and (ii) government sponsored infrastructure projects competing for resources. It is likely still mostly demand led, but not exclusively by consumers.
It is worth noting that three of the next four largest sources of inflation attributed to demand pressures are coming via government administrated taxes and fees (tobacco, education and health).
What we can say with some certainty is the subsidy impact on electricity falls out of the CPI calculations moving forward and wholesale electricity futures remain relatively well behaved. This suggests that the largest component driving the demand-led signal for prices effectively disappears in coming months. Moreover, the evaporation in house and land enquiries recorded by Australia’s largest home builders is indicative that price pressures in this sector will soon fade. Higher interest rates, negative gearing policy changes and a sharp fall in work yet to be done in the engineering sector also suggests that demand for the same labour and materials used in home construction will also ease in the year ahead.
Fig 3. Where is the demand signal coming from? (Demand-driven CPI contribution by category, 2025Q3–2026Q2)

Source: YCM, RBA, Oct 2026.
Importantly, demand-led inflation that can be attributed traditional consumer discretionary categories over the past year was essentially zero.
Same method, different lens
While we find this identification approach to inflation interesting, by exclusively focusing on final consumer prices important insights may be missed that a full economy wide assessment may capture.
In the rest of this note we shift the focus of the analysis and apply the Shapiro and RBA method to the ABS’s national accounts industry structure instead of the consumer facing CPI data. That is, we are focused on movements in the changes in the implicit price deflators and volumes for all 19 industries (plus housing) of the economy.
The key difference is the lens that we are applying. The CPI measures what households pay, imports included. Industry “value added” measures what all Australian producers charge for their own output.
Households are not the problem
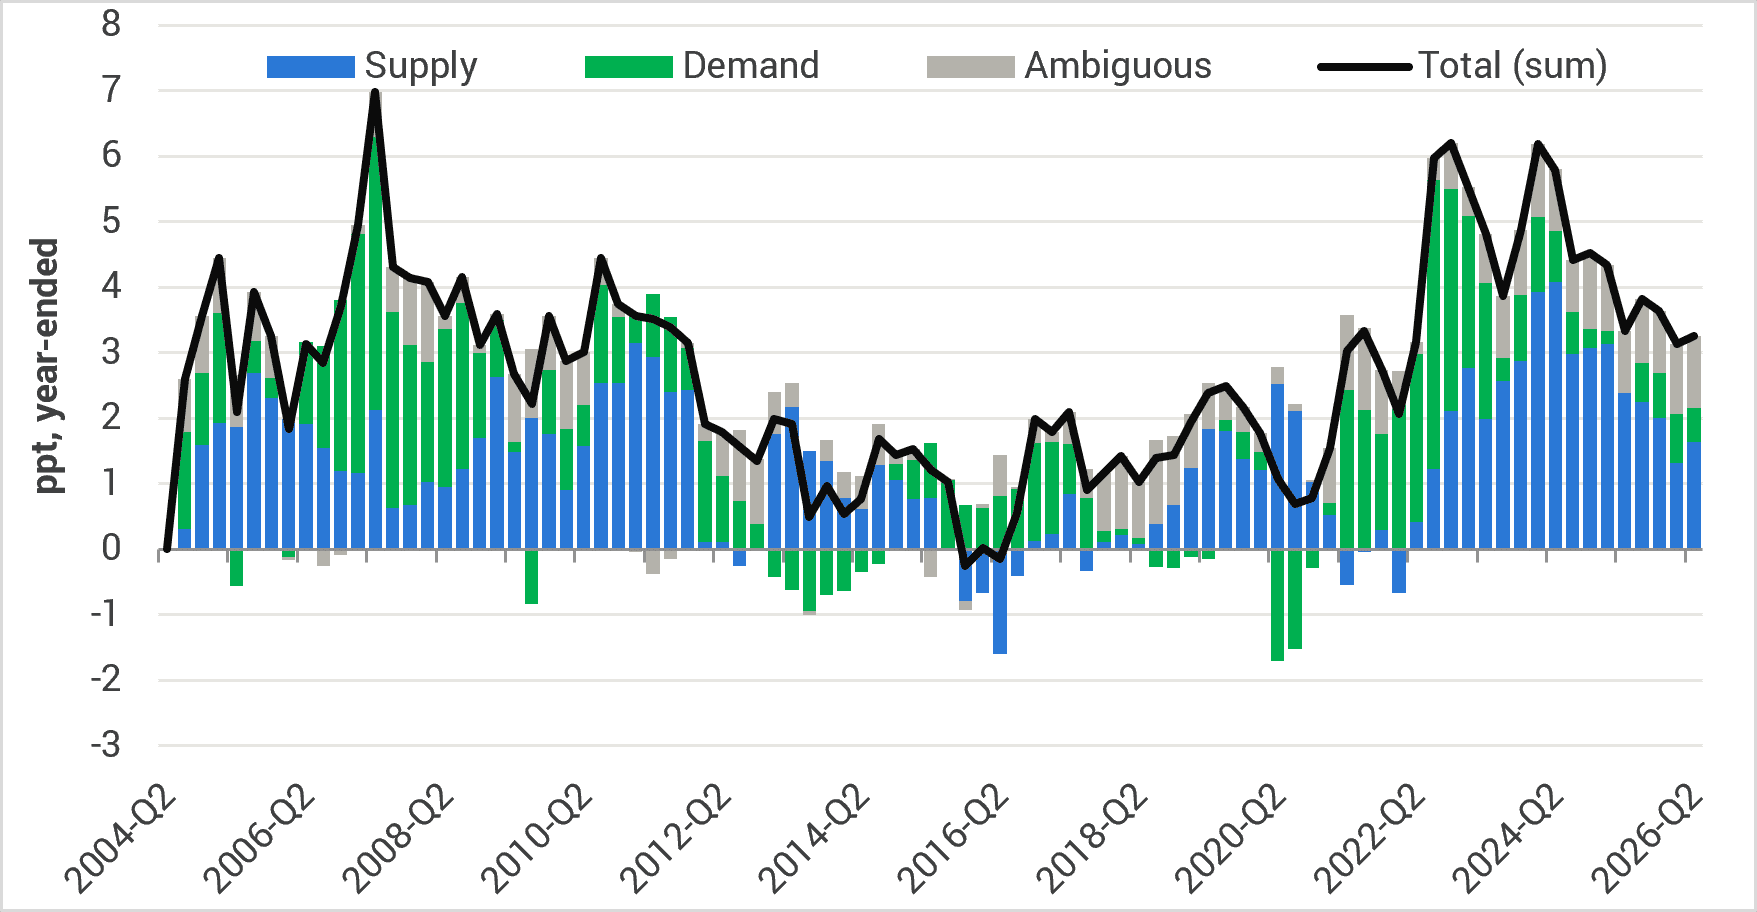
Figure 4 shows the evolution of the supply and demand shocks for the whole economy ex-mining and Figure 5 shows the market sector (i.e. ex-government) which comprises those market industries that sell to households: retail, hospitality, food, utilities, construction, transport, telecoms, insurance, recreation and personal services.
Fig 4. GDP ex-mining (Supply- vs. demand-driven contributions to deflator growth)
Source: YCM, RBA, Oct 2026.
Fig 5. Market sector ex-mining (Supply- vs. demand-driven contributions to deflator growth)

Source: YCM, RBA, Oct 2026.
Some key observations from our economy-wide price analysis immediately stand out compared to the RBA’s consumer price analysis.
Firstly, our approach identifies the largest supply shock to domestic production prices occurring through 2020, coinciding with the COVID-related disruption to supply chains and surge in freight costs. In contrast the RBA supply shock is identified in consumer prices some two years later. Some delay can be attributed to lags in the production process and decisions made at the firm level on whether to absorb rising supply costs in margins. Nevertheless, our series appears to better match the lived experience of firms who endured the initial shock of component shortages due to COVID lockdowns and then the second wave of cost increases from structural shortages and supply chain diversification costs.
Secondly, the supply driven contribution to inflation has recently moderated at the producer level compared to the RBA’s assessment at the consumer level (refer Figure 6). This suggests that some supply side pressures are starting to moderate at the producer level, which will flow through to consumer in time in the form of lower prices.
Fig 6. Supply-driven contribution to inflation: Producer v Consumer

Source: YCM, RBA, Oct 2026.
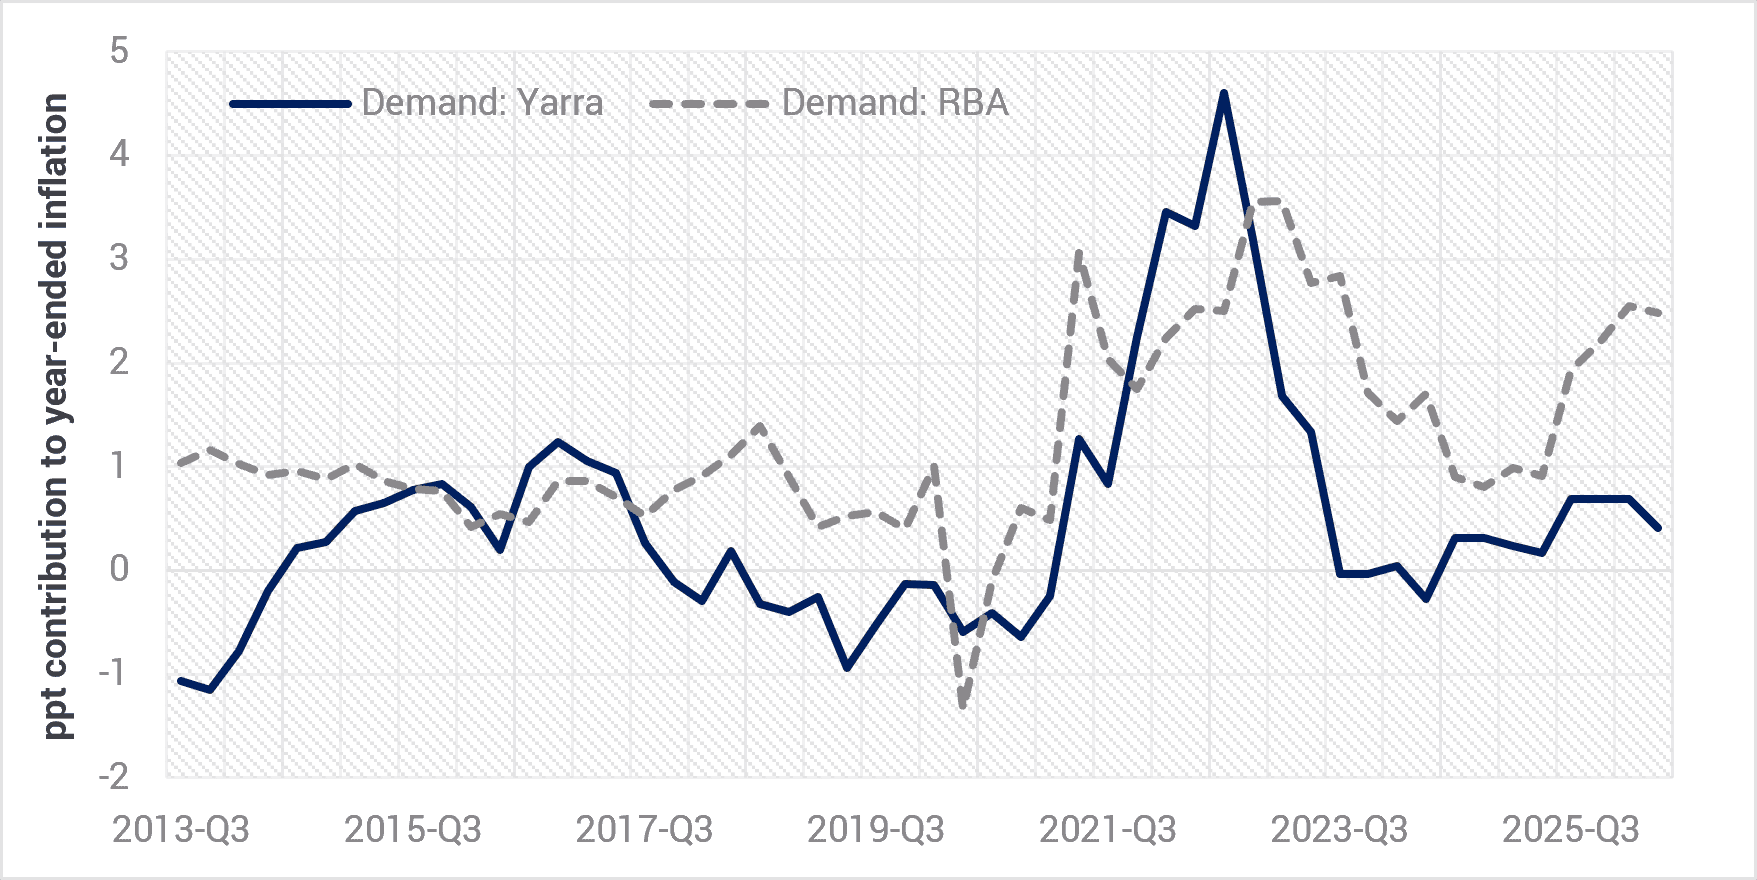
Thirdly, during the 2021–22 surge in inflation, demand shocks added up to 4.6 percentage points to inflation (refer Figure 7), so it is reasonable to conclude that the RBA was right to tighten policy through that period. However, since mid-2023, at the firm level demand led shocks have added close to zero to inflation.
Fig 7. Demand-driven contribution to inflation: Producer v Consumer
Source: YCM, RBA, Oct 2026.
The RBA’s CPI basket approach clearly tells a different story. Its demand component eased back to its pre-COVID level in 2024–25, then rose again, to 2.5 percentage points in the year to June 2026. The two series use the same method, but they measure different things.
The pressure sits with government
So where is the domestic pressure?
Table 1 helps bring this into focus. The non-market sector: public administration, education, and health and social assistance is 20% of the economy. Since mid-2023 it has delivered 29% of output growth and 26% of producer price growth outside mining. Importantly, its prices are rising 5.2% a year, faster than any other group and three times its pre-COVID pace.
Table 1. Contributions to GVA price growth[1]

Source: ABS 5206.0 Tables 6 and 45, YCM calculations.
This is demand, but it is not household driven demand. It is government-funded spending on health, disability and education services, and it competes with the private sector for the same workers. The sign-restriction method labels most of this sector’s price growth as supply or ambiguous, because its volumes are measured from public employment numbers. In our view, that wage cost is the channel through which public-sector demand shows up as “supply” pressure in other industries.
The rest of the gap is imported
The RBA’s CPI benchmark and our household-facing producer series are built using the same statistical method. The big difference between them is what enters the price index: the CPI includes imported goods, and domestic value-added industry approach does not. So the gap between the two is a rough measure of what imports contribute, and that gap is large.
In the year to June 2026, the RBA’s benchmark puts demand-driven inflation at 2.3 percentage points. However, our measure of domestic producers who sell to households shows 0.6 percentage points. In the 2021–23 surge, the RBA benchmark attributed 2.6 percentage points to supply-driven inflation; our domestic series attributed none. That supply shock was freight, fuel and goods coming in through the ports. In the local data, the evidence to date is that those costs have tended to show up as margin squeeze, not price rises.
The demand signal in the CPI largely therefore reflects spending on imported goods and services and the margins earned on them. Spending that leaks offshore is not a sign that domestic producers are running out of capacity.
What could make us wrong
We should be clear about the limits.
- The import attribution is inferred from the gap; we do not measure it directly.
- Non-market volumes are measured largely from inputs such as public sector staff numbers. That is why the method labels so little of the government sector’s price growth as demand. It reads that growth as cost, not demand-pull.
- Moreover, it is worth noting that up to 2.5 points a year still lands in the ambiguous bucket.
None of these points overturn the central finding: since mid-2023, demand-driven inflation among household-facing domestic producers has stayed below 0.7 points a year under every specification we tested. The RBA’s CPI benchmark puts it at 1.4.
Incorrectly attributing a price spike to excess demand is a very costly mistake
The RBA’s own conference paper estimates that it correctly identifies demand-driven inflation only about two times in three. It also finds the costliest error is tightening against inflation that is not really demand-driven, and that the cost falls hardest on low-wealth households.
Our results suggest that error is likely happening now. The cash rate works through domestic household borrowers, savers, and private businesses’ investment decisions. It has little purchase on a government sector expanding to deliver health, disability and education services. It also has little influence on imported prices, unless the RBA engineers a material currency appreciation.
The consumer economy is clearly in a transition phase. Discretionary retail updates from the listed sector suggest a consumer in sharp retreat since August, the credit cycle has turned down, the housing market appears in a sustained correction, and the combination of higher interest rates and fuel prices is cruelling consumer sentiment.
Our analysis suggests that if Australia genuinely wants moderation in inflation pressures, the most effective lever is fiscal. Specifically, actively slowing the growth of the non-market sector. Misinterpreting the causal driver of the inflation shock means higher interest rates and the household-facing share of the economy carrying the cost of a problem it did not create.
+++
[1] Since mid-2023 = 2023Q2 to 2026Q2. Share of GVA = 2026Q2.


0 Comments