Financial economists have largely abandoned their expectations of another one or two rate cuts in this cycle, interest rate futures are currently pricing that the next move in interest rates is higher and commentary has become increasingly apoplectic that the RBA has erred in easing policy and rate hikes should be considered in coming months.
The RBA Board now appears to have also been spooked by recent inflation data and are now considering upside risks to the inflation outlook. However, we see very little reason to alter our expectations for interest rate cuts from May 2026. Suddenly, this is a non-consensus and controversial position to hold.
However, there appears to be poor understanding of recent inflation dynamics by many economic commentators. The sharp shift in views comes from three primary arguments; (i) the annual rate of inflation is now well above the mid-point of the RBA inflation target range; (ii) housing related inflation is increasing; and (iii) a recovery in private demand will drive up sticky services inflation in 2026.
These are not unreasonable concerns if the underlying pulse of inflation had actually lifted. That is, when there is broad-based evidence that inflationary forces are building in the economy across the supply channel and a shift is evident in pricing behaviour throughout the inflation basket then it would be time to reassess.
But that is not what has happened to date. Indeed, most analysts seem to be confusing base effects – that is, the cycling of a particularly friendly inflation print a year earlier – with current period inflationary pressures. Few, if any, have realized that the primary cause of recent high annual inflation has been some States using up their annual allotment of electricity subsidies which caused a temporary increase in electricity prices in August and September.
However, households in NSW and ACT whose billing cycle was July will not only again receive the same level of subsidy they enjoyed in the June quarter, they will also receive a double payment in the December quarter. WA households will also see their State funded additional subsidy for eligible households extended into early 2026 via an annual payment.
To put this in context, electricity prices inclusive of the subsidies contributed 60ppts to the 3.8% (y/y) inflation print in October. This contribution can be seen via the trajectory of the red line in the chart below. Note that the large impact upon inflation of cycling the October 2024 peak subsidy. Even though some of the renewed payments of subsidies had already started to lower electricity prices sequentially in October 2025, the impact on annual inflation was very significant.
The September and October inflation ‘shock’ was mostly merely this electricity subsidy base effect. Naturally, the shock would have been worse if the subsidies were not extended, but they were extended and the green line in the chart below provides an indication of the impact that electricity prices will have on inflation in the November and December period.
In other words, the primary shock to Australian inflation that altered inflation expectations so acutely in recent weeks will reverse out of the annual inflation rate as soon as it arrived.
Chart 1. Electricity and Subsidies Impact
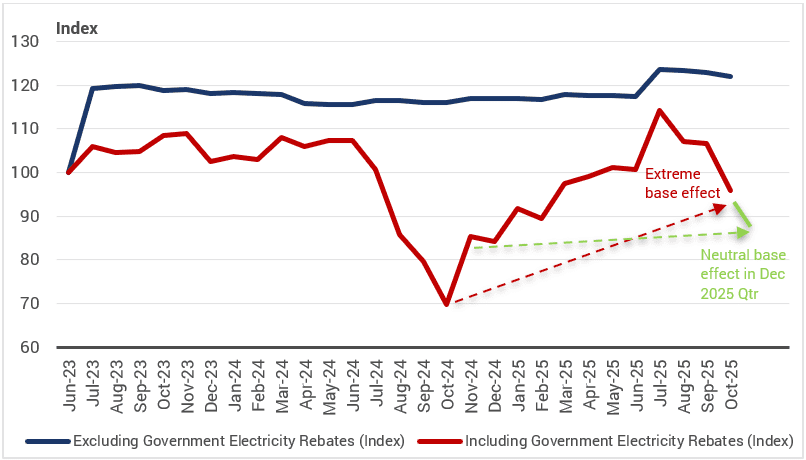
Source: ABS, Yarra Capital Management.
Subsidies are unlikely to be extended in the MYEFO for 2026 at the Federal level. This will again induce some further volatility in headline inflation during 2026, although the extension of some State-funded utility subsidies may occur. The exact outcome for inflation will also depend on wholesale price trends, and in recent months electricity futures have clearly been in retreat.
Regardless, no sensible person should confuse price movements due to subsidy changes with excess demand growth. Indeed, after a decade of flat volume growth in per capita utility consumption, demand has plummeted by 12% over the past two years: despite the provision of subsidies, Australian households have curtailed their volume of electricity, gas and water usage by more than any other period since the data commenced in the mid-1950s. That is hardly a sign that households were overcompensated via the subsidy. The sensible approach is for policy makers to look through supply-side shocks to inflation in the absence of an upward trend in inflation expectations.
Base effects will continue to impact headline inflation until April 2026, likely keeping the annual rate of inflation above 3% until then. However, it is important to note that high monthly inflation prints in November and December 2024 will fall out of the annual calculation over the next two months, at exactly the same time as the likely reversal of the electricity subsidy effect from mid-2025 into end-2025.
If policy settings had erred and inflation was accelerating sequentially then it would be better to look at six or even three-month annualized growth rate in prices. It might surprise some to learn that the average monthly inflation rate since May 2025 has been 0.2% (m/m), a pace that is consistent with the mid-point of the target zone, the six-month annualized pace decelerated to 2.7% (y/y), and the admittedly volatile, three-month annualized pace is just 1.5% (y/y).
If inflation in the next six months posts the same average monthly rate as the past six months, then the six and three-month annualized inflation rate will remain below the mid-point of the RBA’s target from January 2025 and the annual inflation rate will be at the mid-point of the target range by April.
These are not inflation figures that warrant a shift in view.
Indeed, it is also worth noting that some of the recent inflation that has appeared in the data is either noise, temporary in nature or obvious mismeasurement. One can always selectively exclude items from the CPI basket to tell a convenient story. However, it is difficult to look past the impact that several items have had on the inflation data recently.
The most obvious is the role of tobacco and the substitution effect of illicit tobacco sales.
Tobacco prices have lifted 41% over the past three years in response to sharp increases in excise taxes. Yet, retailers and industry reports suggest that illicit tobacco sales are now between 25-30% of the market. The ABS has gradually reduced the weight of tobacco in the CPI basket over time, reflecting a reduction in smoking rates. However, there is not an explicit attempt to account for illicit tobacco sales.
For instance, if illicit sales were 10% of sales in 2022 and this has lifted to 30% in 2025 and the average price for a packet of illicit cigarettes is closer to $20 compared to $50 for a legal packet then it’s likely that the CPI has overstated tobacco inflation in the past three years by approximately 23% and headline inflation would be 0.2% lower in each of the past three years.
The ABS recently revealed that it is working on including illicit tobacco sales as part of consumption. The ABS might therefore have to increase the weight of tobacco in the consumer basket and use a blended price of legal and illegal sales. The net result is that this should prove a disinflationary impact once the ABS makes the adjustment, albeit such a change is not likely not until September 2026. In the interim, any sensible discussion about inflationary pressures should exclude tobacco prices from the inflation numbers.
The less obvious impact on inflation in 2026 has been the role of President Trump’s policies on local inflation. This is less about tariffs, albeit the jury is still out on whether Australia is in part subsidizing a higher global price for US tariffed goods or whether diverted goods from US markets are landing at Australian ports at discounted prices. Thus far, it appears it is the latter given import prices for imported manufactured goods have been declining gradually over the past six months. Indeed, sharp rises in women’s clothing and footwear in the CPI data appear to be more like noise than signal, given import prices of these items remain in decline. Historically, these aberrations quickly revert to trend.
Similarly, a sharp rise in meat prices through 2025 is likely a combination of the Bureau of Meteorology forecasts for dry weather and US tariff uncertainty which saw farmers lowering herd numbers in early 2025, only to be left scrambling to restock as a much better agricultural season eventuated and meat sales to the US remained strong. Even before the recent removal of US tariffs on Australian beef, export volumes of beef were 17% higher in the year to October compared to the same time last year. Nevertheless, sharp movements in agricultural prices are typically viewed as temporary rather than structural inflationary forces and the recent rise in meat prices in Australia should again be viewed in that light.
Perhaps the most unusual aspect of recent inflationary forces has been the contribution to inflation from the price of jewellery. In particular, the passing through of the cost of surging gold and silver prices by retailers has had a non-trivial impact on consumer price. We can’t be certain whether it has been Trump’s role in undermining: (i) institutional trust; (ii) the outlook for the US$, and (iii) the outlook for US debt that have been the primary reasons for the surge in precious metal prices or whether other forces are at work – but it is unlikely we see a similar rate of change in precious metal price increases in 2026 as witnessed in 2025.
Chart 2. Annual CPI contributions to October 2025
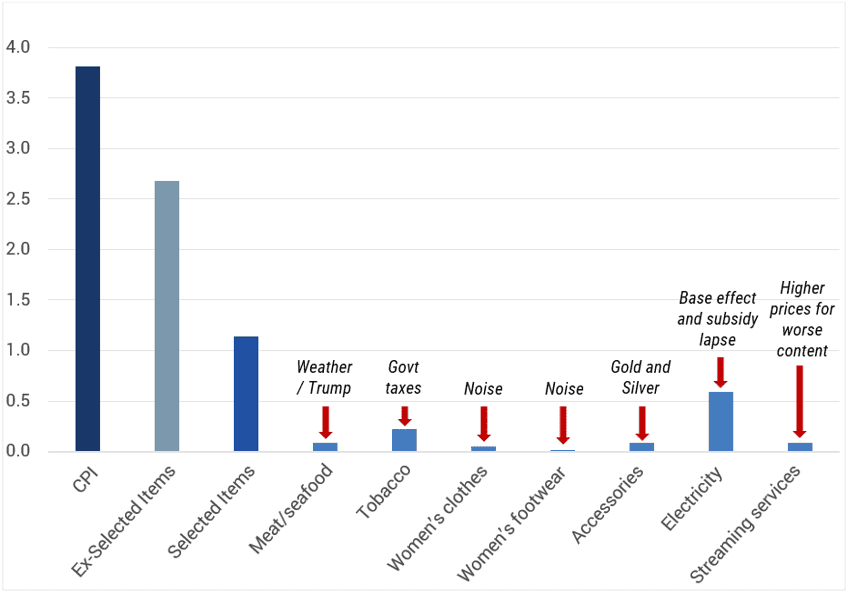
Source: ABS, Yarra Capital Management.
The one item that we have included in ‘selected items’ in the above chart that is likely to show persistent price pressures is the cost of streaming services. The irony here is that the firms that are investing heavily in AI content are also the ones rapidly increasing prices for their subscription services. Disney, Apple, HBO Max, Amazon Prime, Spotify, Kayo, Microsoft 365 and Netflix have all increased their prices significantly over recent months citing the rising cost of content creation.
If we are waiting for AI to be a disinflationary force in Australia, it seems we might be waiting for some time.
If we exclude these ‘selected items’ from the inflation calculation, then Australia’s reported 3.8% (y/y) inflation is merely 2.7% (y/y). In other words, the RBA can justifiably make the case that inflation can be expected to return toward the mid-point of the target band as some of these distortions normalize. This case is easier to make given that the distribution on both the longer running quarterly inflation series and the more timely monthly series is basically unchanged since the start of the easing cycle.
Even if we don’t exclude any items from the consumer basket there are only very marginal shifts in the distribution of annual inflation pressures that can be detected in the recent data.
The message from the below two charts is that Australia still has ~40% of the items in the consumer basket below the bottom of the RBA target band. There is a little less outright deflation in consumer goods in recent months but the proportion of items running above 3% has barely lifted at all.
Chart 3. Distribution of inflation (quarterly data)
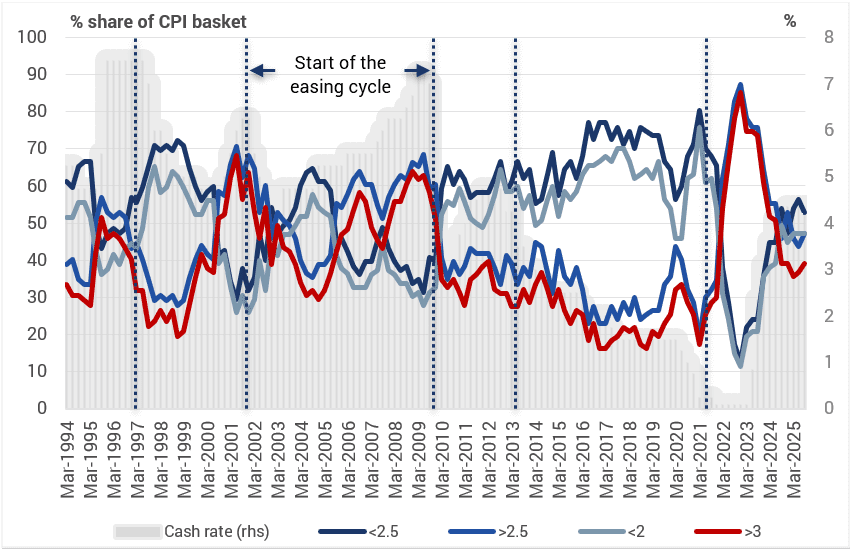
Source: Yarra Capital Management.
Chart 4. Distribution of inflation (monthly data)
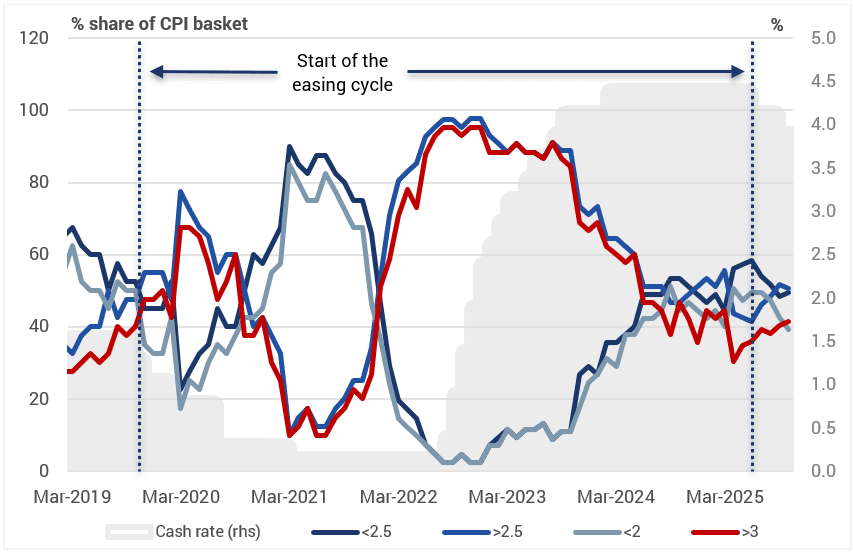
Source: Yarra Capital Management.
The time to be concerned is when there is a clear and discernible shift in the distribution of inflationary pressures. The reality is the distribution is not materially different from when the RBA advocated for the commencement of the current easing cycle.
It would be remiss to not comment on housing-related inflation, given the RBA has repeatedly asserted over recent weeks that that one of the key inflationary pressures they are watching was the lift in home purchase costs in the CPI data.
This is not to be confused with the price of established homes which is excluded from the CPI data. Instead, it captures the price of new home and land packages. A modest increase in home and land packages is not a function of excess demand for new homes, quite the opposite. It reflects the gradual removal of developer discounts used to attract sales during a very poor sales environment of 2023 and 2024, in part due to the 13 rate hikes the RBA delivered through that period.
The removal of temporary developer discounts is hardly the source of a sustained threat to domestic inflation, particularly as the recovery in housing approvals appears to be petering out already in this economic cycle. Rents may be a different issue, and they do warrant watching. There are signs that advertised rents are rising and as such realized rental inflation in the CPI data will be a contributory force to inflation again in 2026. However, raising interest rates to counter a dramatically undersupplied housing market is the very definition of a self-defeating policy.
So why do we have conviction that the next move in rates is likely to be lower rather than higher?
By May of 2026 we expect three key events to have aligned:
Firstly, the distortions provided by subsidies and ‘one-off’ factors (e.g. growing conditions, gold prices and women’s apparel) will have moved out of the data and friendlier base effects will likely return inflation to the mid-point of the target band.
Secondly, the new Fed Governor will be in place and we expect at least 100bps of easing from the Fed in 2026. While the RBA will be loath to say anything other than they set policy based on domestic conditions, every central banker knows that there are limits to interest rate dispersion between countries.
Lastly, the US$ downtrend may have stalled in 2H25, however, the combination of a dovish Fed and a messy lead into the US mid-terms is likely to see investors again moving to allocate outside of the US through 2026. In concert with what we still regard as strong building blocks for emerging market demand growth, there is a strong prospect that the Australian dollar will appreciate significantly in 2026. This is highly relevant for the RBA which has been down weighting the role of ‘cash flow effect’ of monetary policy and upweighting the role of the ‘exchange rate effect’. All else equal, a materially higher Australian dollar would encourage the RBA to ease interest rates to prevent an unplanned tightening in financial conditions.
It is worth noting that the RBA’s current set of economic forecasts embed a further 25bps of monetary easing and a stable exchange rate. There was nothing in the recent set of National Accounts that suggests a broader breakout of inflationary pressures. Indeed, the National Accounts are a broader data set and good cross check on the CPI data, and it shows a comforting moderation in six-month annualized consumer and domestic demand inflation to a 2.8% p.a. pace.
On our estimates Australia is operating at -0.5% output gap, the equal largest output gap alongside Canada, compared to the G7 peer group and significantly greater than the USA. More importantly, labour productivity appears to have commenced an upcycle, meaning we expect productivity to trend higher in coming quarters supported by the recovery in private demand and the embracing of AI and related technology.
With wage inflation undershooting RBA expectations, the labour market indicators still in slow retreat, import prices moderating and productivity in the early stages of uptrend there is little rationale to genuinely fear a risk of an inflation breakout.
Chart 5. Population, Productivity and Economic Growth
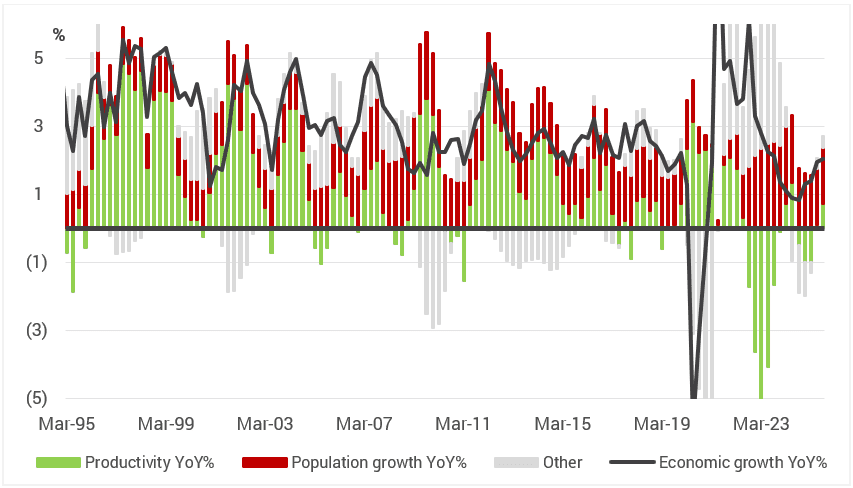
Source: ABS, Yarra Capital Management.
In fact, we continue to believe that things will be feeling very different by May of 2026.
Inflation will be closer to target, productivity will be closer to trend, government demand will continue to retreat as a driver of economic growth, the A$ will be materially higher and a Trump-aligned dovish Fed chair will impart another large monetary easing cycle by the US which will be partly aped by major Western central banks.
There is very little reason to expect the RBA to embark on an independent tighten cycle, other than a misinterpretation of the inflation data. We still expect the RBA will be ease policy 50-75bps in 2026 with May, August and November 2026 the most likely windows for easing. It might be a controversial view, but after scrutinizing the local data and the external environment, it still appears to us to be the most likely outcome.


0 Comments