By Tim Toohey, Head of Macro and Strategy, Yarra Capital Management
Self-managed super funds (SMSFs) in Australia have some peculiar attributes, the most glaring being the almost complete rejection of international assets in their asset allocations and a seemingly unhealthy obsession with relatively low yielding cash deposits. Just 3% of SMSF assets are allocated to offshore investments and a massive 16% of assets are allocated to cash. In comparison, larger super funds allocate 38% of their assets to offshore investments and hold 9% in cash (refer Chart 1).
Chart 1: Large Super and SMSF Asset Allocation
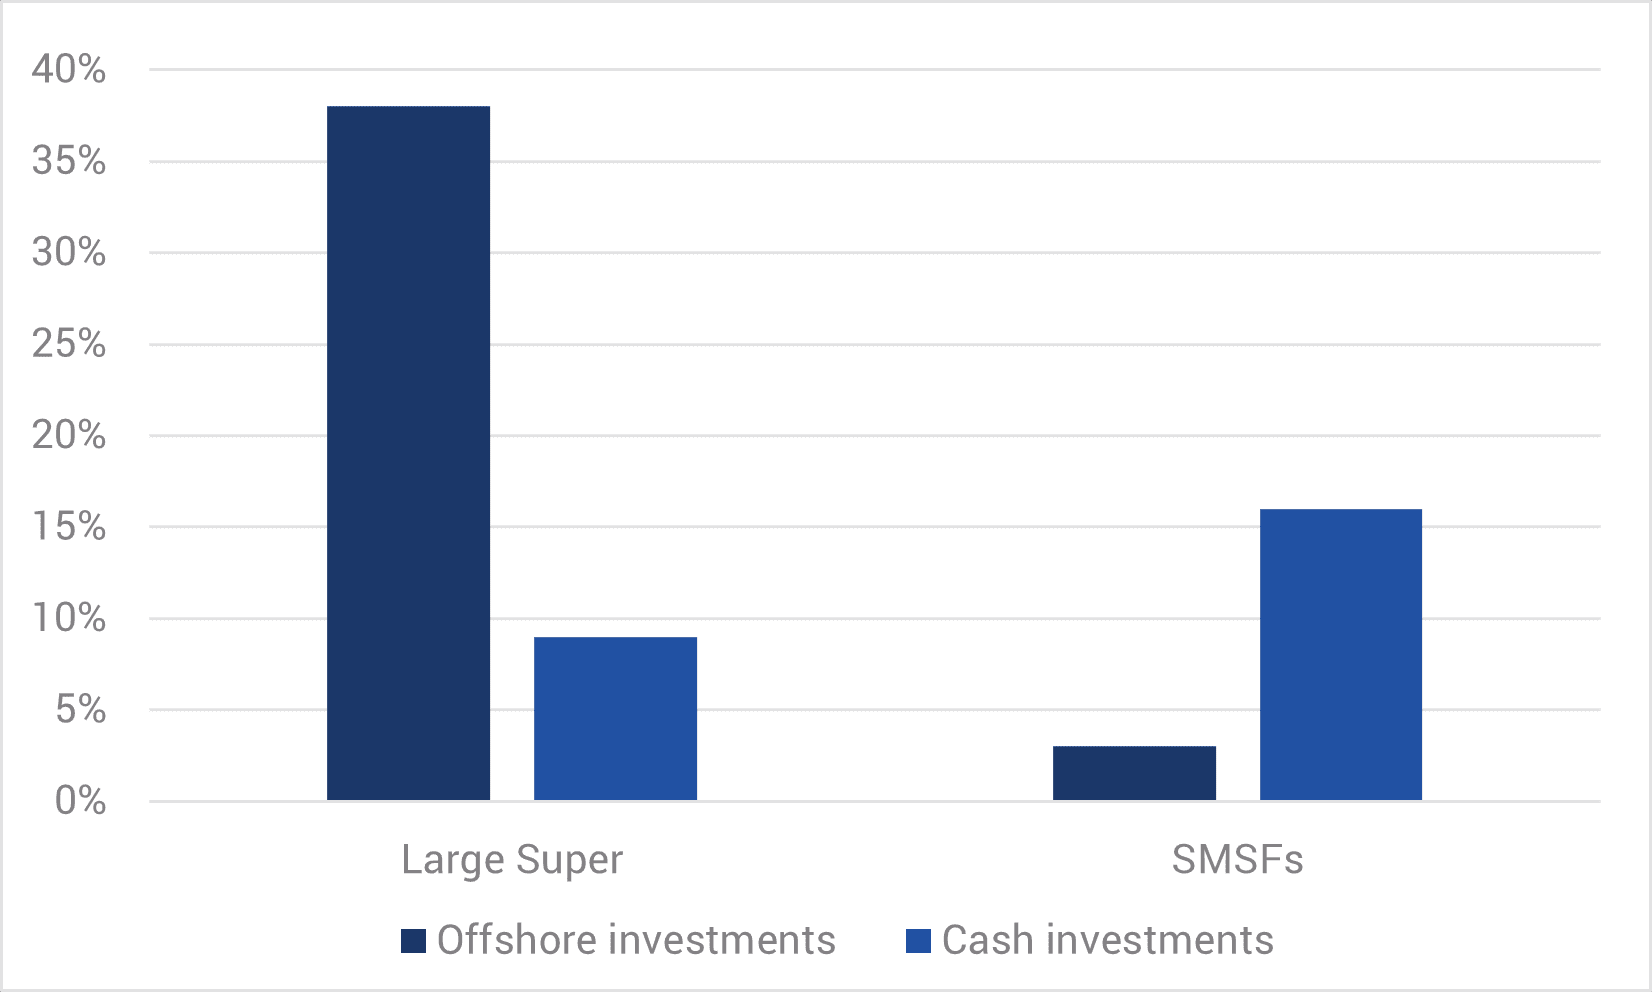
Source: APRA, ATO. Data as at 31 Dec 2024.
Given the strong performance of global equities in recent years, it is reasonable to assume that returns in SMSF would have underperformed the larger – and presumably more professionally run –superannuation runs.
The data, however, tells a different story:
- As at the end of the Dec-2024 quarter (the most recent data available) SMSF net assets totalled $981bn, having risen an impressive 38% over the prior four years.
- Compared to APRA’s superannuation statistics for Large Super[1], total net assets stood at $2,986bn as at the end of the December quarter, having also increased 38% (in this case over the prior five years).
Despite their conservative cash holdings and extreme domestic focus, SMSF’s have grown just as fast as their larger and more sophisticated cousins and now represent 25% of total superannuation assets. How is this possible?
There are four conventional ways this could happen: (i) attracting a greater share of younger members; (ii) rollovers from Large Super; (iii) higher net contribution flows; or (iv) superior asset allocation decisions. However, in evaluating the evidence it becomes increasingly clear that the primary reason for superior SMSF investment returns comes down to tax.
1. Are more young people joining SMSFs? No.
There is no evidence to suggest that a significant shift has occurred towards younger members in SMSFs. Of the 1.174 million SMSF members, just 3.3% are below the age of 35. This compares with 26% of the members in Large Super being below the age of 35[2], and this share has been stable since 2019.
Given the share of the population between the ages of 15-34 has remained steady at 27% over the past five years, which is virtually identical to the share of Large Super for this age group, it is safe to conclude that the growth in SMSFs is not due to younger people choosing to join SMSFs in greater numbers.
2. Have existing members of Large Super been shifting into SMSFs in large and increasing numbers? Yes, but it’s not a big contributor.
The number of member accounts under the Large Super umbrella declined by 2.6% over the past five years, whereas the number of SMSF accounts expanded by 9.0%. While the shift is clear in terms of the number of member accounts, the dollar value shift is somewhat less impressive.
Net rollovers from Large Super into SMSFs totalled $7bn in 2024, up 35% in the past year and 114% over two years. Despite this rapid growth in rollovers, as a share of SMSF’s total assets rollovers in 2024 represented just a 0.7% share of the total. Over the past four years rollovers into SMSFs as a share of total SMSF assets represented just 2.2%. That is, of the 38% increase in SMSF net asset growth over the past four years, only 2% can be attributed to a shift from Large Super to SMSFs.
In short, rollovers from Large Super have played more of an ancillary role to SMSF’s growth. It is clearly not the main story.
3. Is there an income and age skew to SMSFs that generate above system net inflows? No. SMSFs are actually in large net outflow.
Chart 2 shows that SMSF members are older (52% are over 60, compared to 34% for Large Super) and Chart 3 shows that they also have higher incomes, with a significant proportion earning over $100,000 annually.
Chart 2: Superannuation members by age cohort
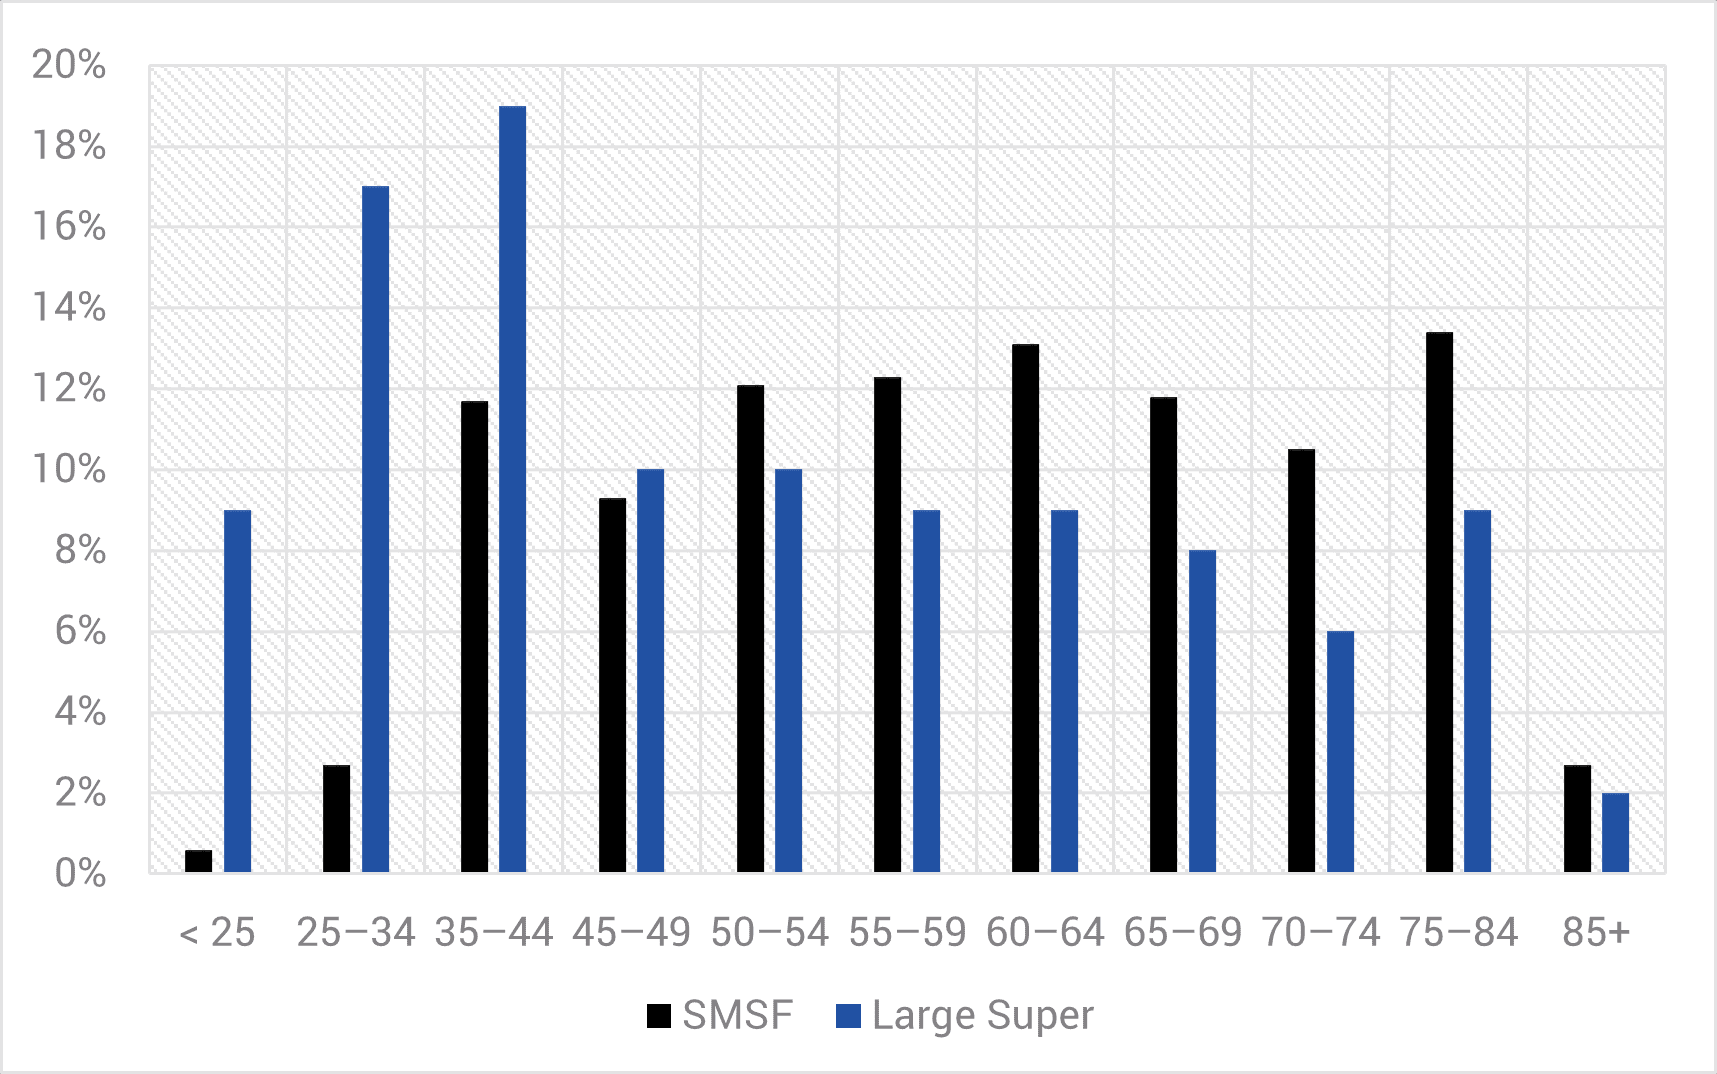
Source: APRA.
Chart 3. Superannuation members by personal income
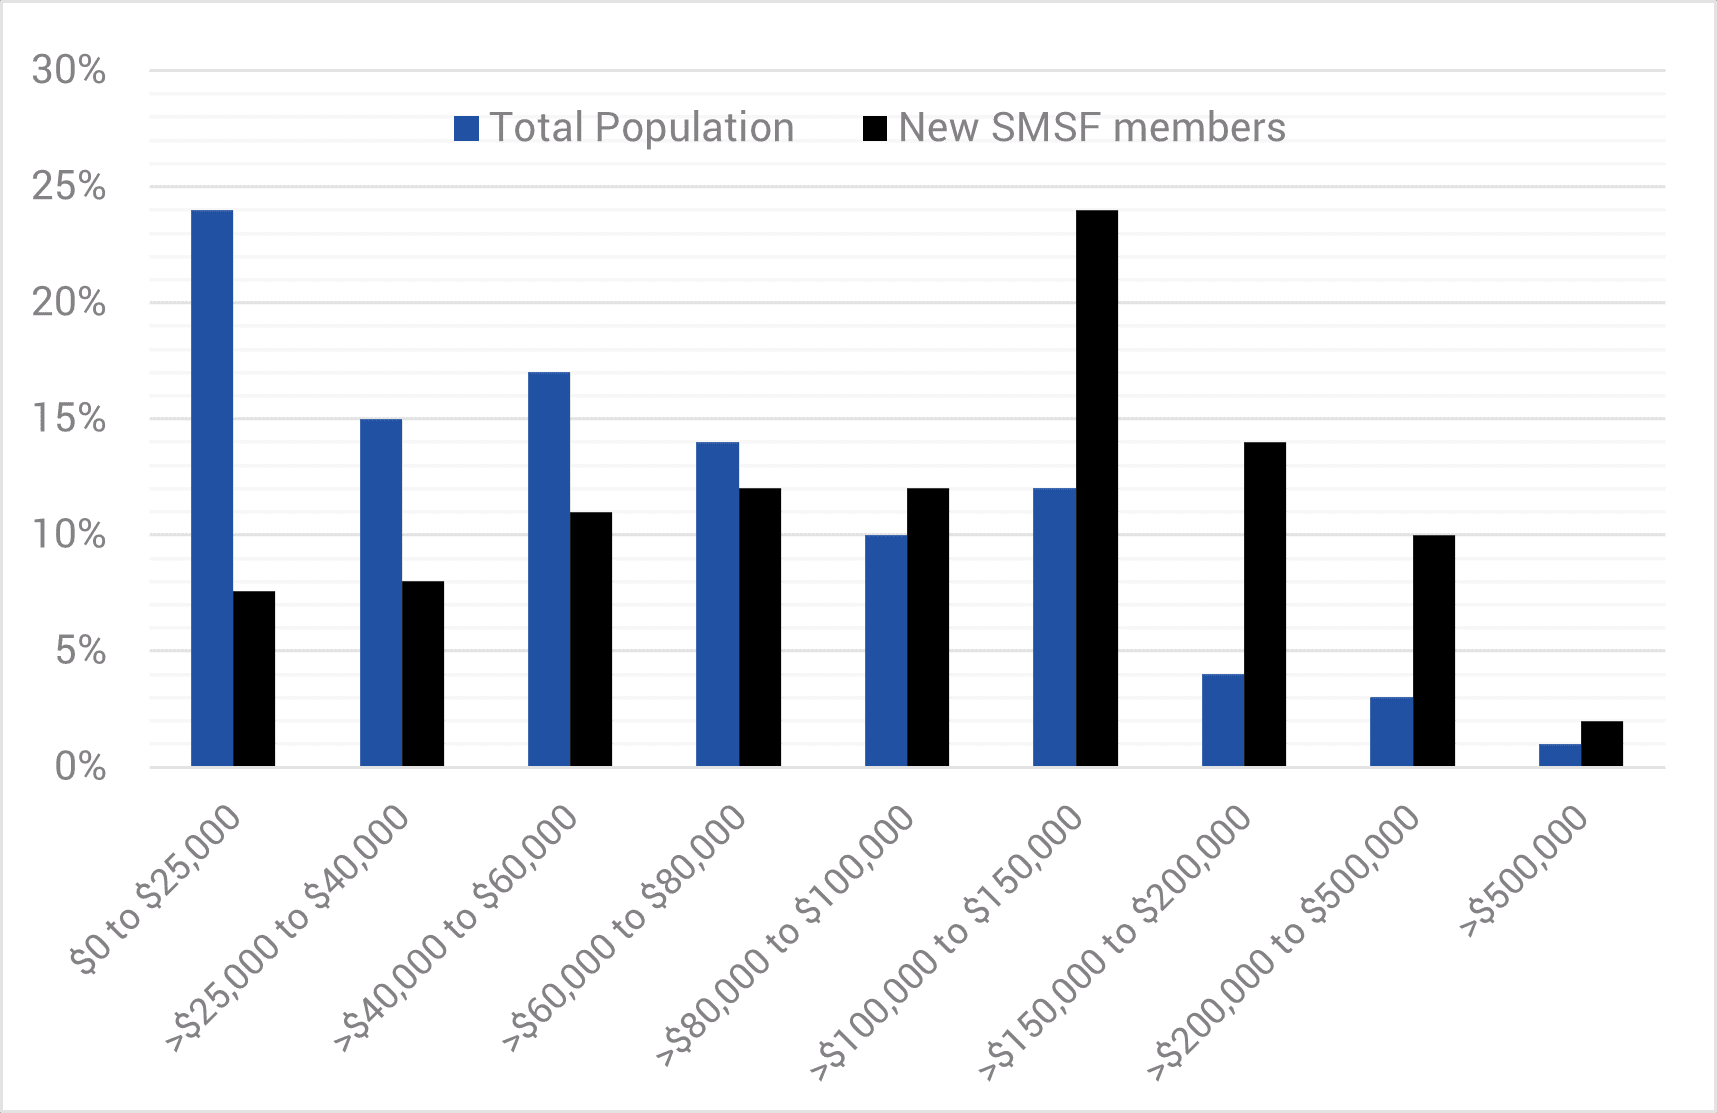
Source: ABS, APRA.
This combination suggests a higher potential for contribution inflows into SMSFs. However, this has not been the case.
Inflows to SMSFs in 2024 were 2.7% of assets, compared to 6.6% for Large Super. Average inflows per member are higher for SMSFs ($22,000 vs. $8,400 for Large Super), but outflows are substantial, with $43.8 billion in benefit payments in 2023–24 against $24.5 billion in inflows, resulting in a net outflow of $19.3 billion (2.2% of assets).
Large Super, by contrast, maintained a net inflow of 2% of assets. Even with rollovers, SMSFs face a net outflow of 1.5% annually, indicating that contribution flows do not drive their asset growth.
In short, SMSF contribution inflows are larger on average than Large Super, but SMSF outflows greatly exceed contribution inflows and, even after accounting for rollovers from Large Super, there is a significant net outflow each year from SMSFs.
4. Surely, it can’t be asset allocation, can it? No, not really.
Bringing this together in a single chart requires us to shift timeframes given the data on SMSF net contribution flows is only provided annually. In Chart 4 we show the growth in net assets for both Large Super and SMSFs over the three years to mid-2023.
Chart 4. Growth in net assets 2019-20 to 2022-23
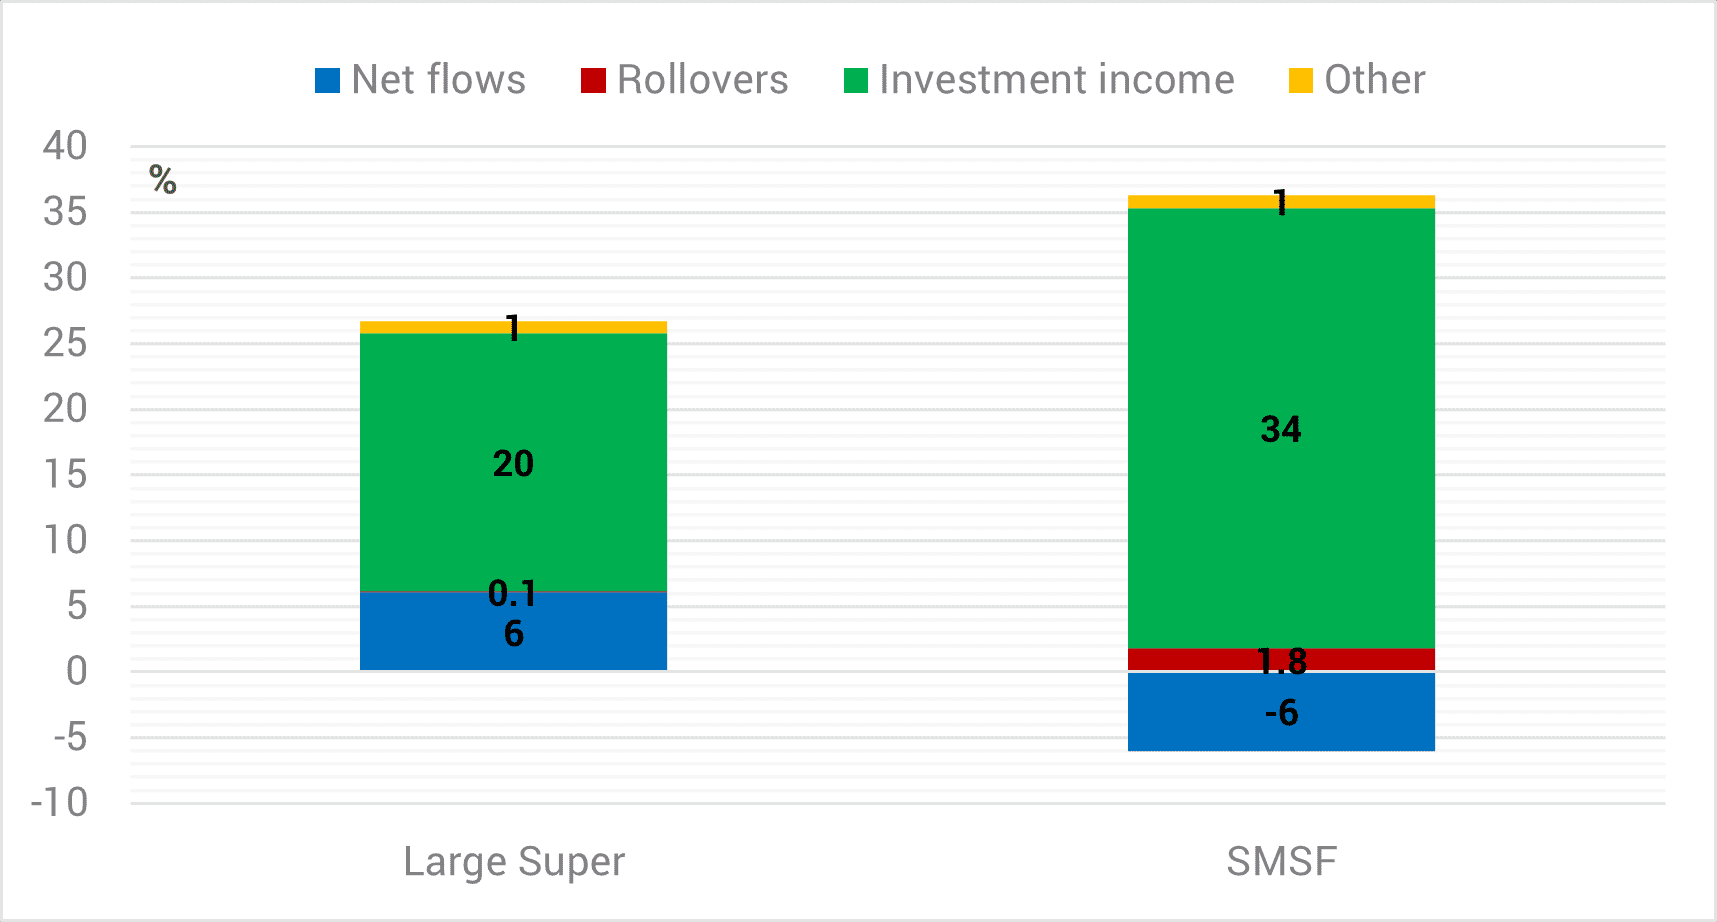
Source: YarraCM, APRA, ATO.
Over this time-period the growth in SMSFs net assets was 30%, exceeding growth in Large Super by 3.5%. While this is notable, the chart clearly shows that once accounting for the impact of rollovers and contributions, SMSFs achieved a 34% investment return compared to 20% for Large Super – a 14% difference in just three years!
This is remarkable data point. How is it possible that individual or Mum and Dad investors achieved vastly better investment returns than professional Large Super investment teams?
Using the differing asset allocation weights of SMSFs and Large Super and the returns of each asset class (in AUD) we can test how much of this excess investment return by SMSFs is due to asset class selection.
When we apply asset class weights and asset class returns we can ratify the accuracy of the reported 20% return over the three years to 2023 by Large Super. However, when we do the same exercise for SMSF we find the asset allocation choices for SMSF generated a return of 23%, slightly better than Large Super, but well short of the 34% investment returns reported by the Australian Tax Office.
So, what is going on?
Asset allocation provided a modest benefit to SMSFs over this three-year period, despite the lack of exposure to booming international equities.[3] However there remains a very large (11% over three years) residual between the investment returns due to the combination of asset allocation decisions and asset class returns and the returns that the SMSFs reported to the ATO that still need to be explained.
By a process of elimination there really is only one other factor left that can explain this large residual – tax.
Do SMSFs harvest far greater tax benefits than Large Super? YES
There are two possibilities that can explain why SMSFs generate greater post tax returns. The first possibility is that they have a far greater proportion of members in the retirement or pension phase where no tax is paid and thus boosting total SMSF returns. The second is that they are using more tax advantageous strategies during the accumulation phase.
The generosity of a zero-tax pension phase is an arrangement that is a uniquely Australian construct and given higher income households have higher superannuation balances it is also clearly regressive.
Given we know that 52% of SMSF members are over 60 years of age, compared to 34% for Large Super members, then approximately half of the 11% excess return residual over the past three years can be attributed to a higher proportion of SMSF members being in the pension phase (i.e. the difference in the proportion in the pension phase (52%-34%) x investment return (34%) x Tax rate (1-15%) = 5.2%).
This implies that SMSF members must also be availing themselves of other tax effective strategies during the accumulation phase that have generated approximately 2% p.a. additional return compared to Large Super over the past three years. At first glance this seems like a high figure, but it is plausible when considering some of tactics employed within SMSFs.
For example, a larger weighting to domestic listed equities (27% in SMSFs compared to 22% in Large Super) suggests that SMSF members are likely to be benefiting disproportionately from targeting franked dividends. We estimate that this explains over half the 2% p.a. additional return, a very meaningful contribution particularly when compounded over time. It is important to understand how beneficial dividend franking can be for superannuation planning, particularly for SMSFs where the beneficiary is approaching retirement. In the Appendix we show the impact on returns over time of having a tax rate well below the corporate tax rate, when combined with a growing dividend stream.
Other options are also available to SMSFs that are likely being targeted. Currently, 6% of SMSF assets are in residential property. The ability to use leverage to purchase residential property inside a SMSF affords negative gearing strategies that cannot be accessed via Large Super. Moreover, the use of tax effective special investment vehicles – which the Federal Government has championed to direct investment towards high technology startups and smaller businesses – provide another avenue for SMSFs to minimise tax during the accumulation phase which is not possible for Large Super to access in scale.
Chart 5 breaks down SMSF returns further to highlight the significance of these tax advantages relative to the investment returns attributable to asset allocation.
Chart 5. Growth in net assets 2019-20 to 2022-23
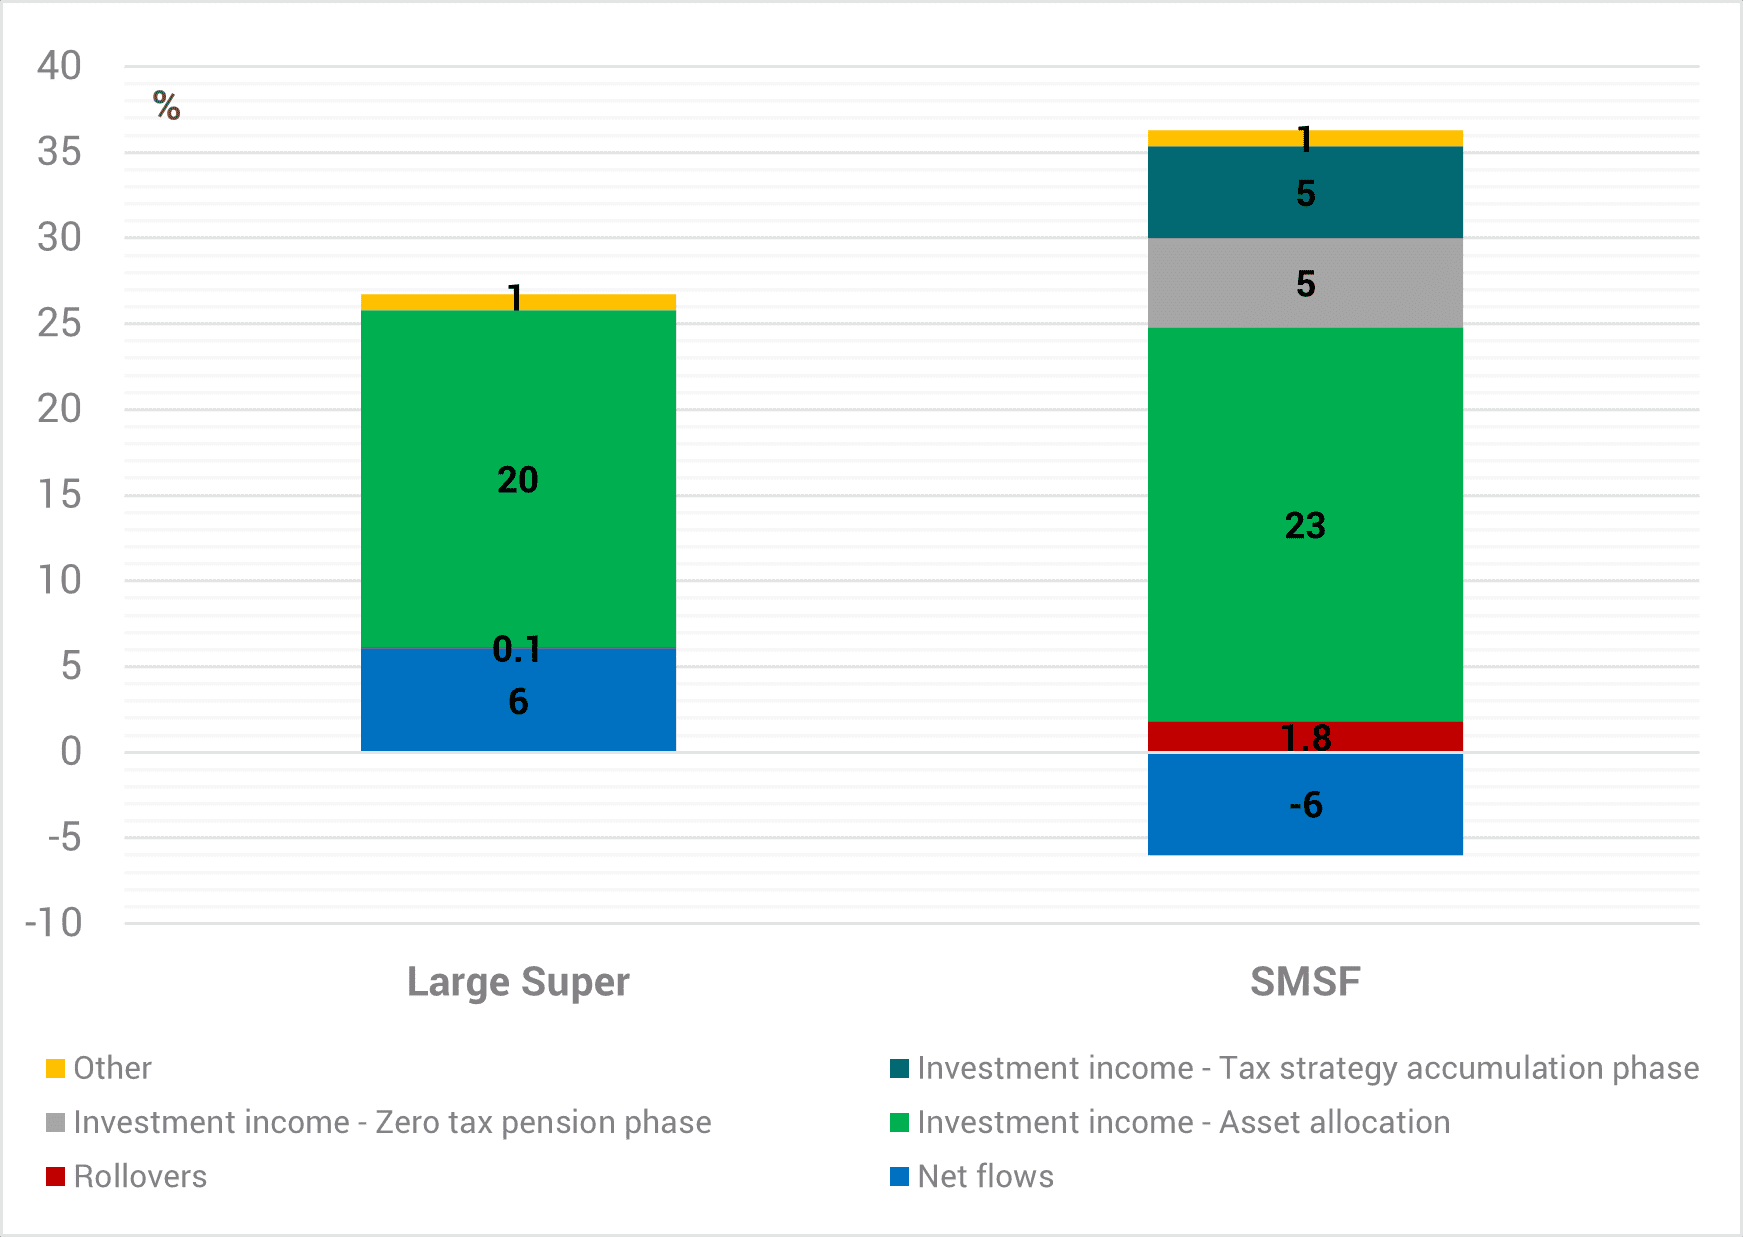
Source: YarraCM, APRA, ATO.
What have we learned?
There are five key lessons from the comparison of SMSFs and Large Super:
1. SMSF net assets have grown as fast or faster than Large Super over recent years and now represent 25% of total superannuation assets.
2. Although SMSF asset growth has been a modest beneficiary of rollovers from Large Super into SMSFs, the drag of assets being in a state of outflow has been a much larger headwind for SMSF asset growth.
3. Investment returns from SMSFs over recent years have been vastly better than those achieved by Large Super. However, investment returns attributed to asset allocation choices are broadly comparable to Large Super.
4. SMSFs have a much higher share of members in the tax-free retirement phase, which we estimate has provided a 1.7% p.a. boost (or 5% over three years) to SMSF growth.
5. SMSFs have a much high share of members approaching retirement and likely to be skewed to highly beneficial franked dividend income streams, negatively geared property and tax friendly investment vehicles. By deduction, we estimate that this benefit to SMSF returns from these investments is also currently approximately 1.7% p.a.
So are SMSF members better investors? No, the asset allocation investment returns are similar to Large Super, but they are older and more tax-wise. SMSF members are enjoying relatively more of the benefit of the tax-free pension phase of retirement and are better able to skew their investment strategy towards tax friendly retirement strategies, which has greatly enhanced both their investment returns and aggregate SMSF asset balances.
The question is will the federal Treasurer now reset his sights on the tax benefits afforded to the superannuation sector in general and the SMSF sector in particular? We think the answer is yes, but with one quarter of superannuation assets now in SMSFs and 1.2 million members it will not be a popular decision.
SMSFs are clearly better for higher income Australians with access to a good tax accountant. But whether this results in a more dynamic and equitable economy is a separate open question altogether.
Appendix – The benefits of franked dividends in superannuation
In the below example we assume a $1 million starting balance, a 5% dividend yield and dividend growth of 3% p.a. A 15% contribution tax for the individual in the accumulation phase converts to a 6.1% post tax yield in year 1. However, by year 10 the post-tax yield converts to a 7.9% yield and a cumulative $123K in tax savings. After moving to the zero-tax pension phase, the post-tax yield converts to the grossed-up yield of 9.3%!
In contrast, if the same investment was made outside of the super system and the individual was on the top marginal tax rate, then they would receive an after-tax dividend yield of 3.8%, some 2.3% less what they would have received in super. Over the 10-year period the SMSF receives a $123K refund from the tax office compared with having to pay $139K if the same investments were held in the individual’s name.
This is a $262K difference!
Table 1. The benefit of franked dividends at concessional superannuation tax rates
Example 1: Investing inside SMSFs

Example 2: Investing outside super
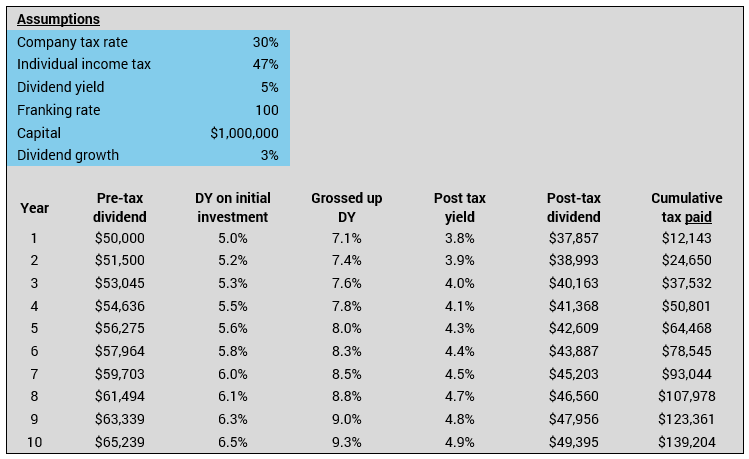
Source: YarraCM, APRA, ATO.
[1] Denoted in this piece to mean funds with in excess of $50 million in assets.
[2] Note that the data by member age stopped being compiled by APRA in 2022.
[3] Over this timeframe SMSFs benefited by having a low exposure to the worst period of bond market performance since Federation and benefited from having large relative exposure to residential property, private credit and loans which posted strong returns. This might be interpreted as luck or skill depending on one’s perspective, yet the salient point is that despite very different asset exposures the returns generated via asset allocation choices was similar for novice SMSFs and professional Large Super.


0 Comments